Peter Lynch: Investment Strategy, Books & Magellan Legacy
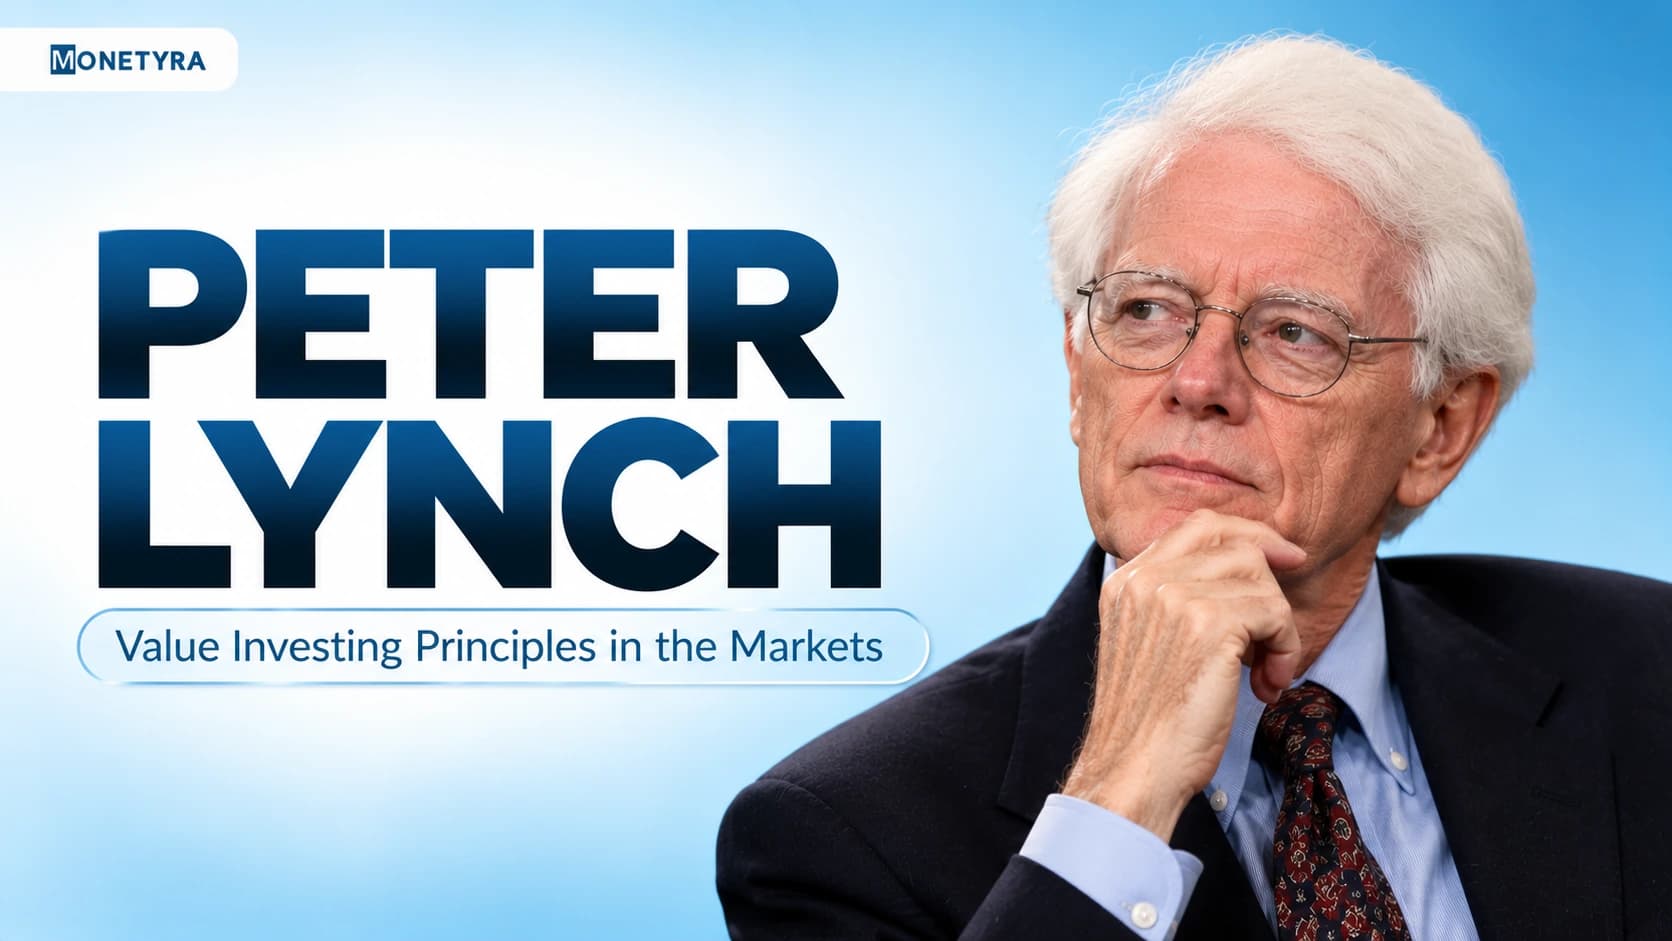
Wall Street institutions often spend millions on high-frequency algorithms, access to management, and complex quantitative models. Yet, Peter Lynch built one of the greatest track records in financial history by arguing that ordinary retail investors actually hold a structural edge over institutional fund managers. Running Fidelity’s flagship Magellan Fund from 1977 to 1990, Lynch demonstrated that observing real-world consumer behavior at shopping centers, grocery stores, and workplaces provides earlier, more practical investment signals than any corporate conference room. His bottom-up investing philosophy demystified equity selection, proving that everyday investors can achieve exceptional returns by combining practical observation with disciplined balance sheet analysis.
Quick Takeaways
- Peter Lynch achieved an unprecedented 29.2% compound annual return managing Fidelity Magellan Fund by focusing on understandable companies with durable earnings expansion.
- The core of Lynch’s philosophy balances ground-level observation with strict fundamental valuation, notably pioneering the price-to-earnings growth (PEG) ratio to avoid overpaying for momentum.
- Liking a company’s product does not guarantee investment success, as holding unresearched consumer brands without assessing balance sheet leverage and debt exposure can lead to severe capital erosion.
Who Is Peter Lynch?

- Current Positions: Vice Chairman of Fidelity Management & Research Company.
- Estimated Net Worth: ~$450 million
- Fidelity Magellan (1977–1990): Grew assets from $18M to over $14B.
- Legendary Performance: Averaged a 29.2% annualized return, beating the market in 11 of 13 years.
- GARP Pioneer: Popularized Growth at a Reasonable Price and the PEG ratio.
- Bestselling Author: Wrote classics One Up On Wall Street and Beating the Street.
Image source: thelynchfoundation.com
Know what you own, and know why you own it. — Peter Lynch
History
Peter Lynch was born on January 19, 1944, in Newton, Massachusetts. His exposure to the financial markets began at age eleven when he worked as a golf caddy at Brae Burn Country Club outside Boston, where he listened to corporate executives discuss stock ideas between holes. Lynch attended Boston College on a caddy scholarship, studying history, philosophy, and psychology rather than pure finance, which helped cultivate his behavior-driven approach to markets. After serving in the US Army and completing an MBA at the Wharton School of the University of Pennsylvania, Lynch joined Fidelity Investments in 1969 as a research analyst covering the paper and chemical industries. He eventually rose to become director of research before taking the helm of the Magellan Fund in May 1977.
Achievement
According to Fidelity’s historical fund performance records, the Magellan Fund compounded at 29.2% annually under Lynch’s stewardship from 1977 to 1990, outpacing the S&P 500 Index’s 15.8% return over the same period. Lynch navigated Magellan through the 1987 Black Monday market crash, outperforming the benchmark in 11 of his 13 years at the helm. He expanded the portfolio to include more than a thousand holdings across diverse sectors, uncovering legendary “multibagger” stocks such as Dunkin’ Donuts, Stop & Shop, Ford, and Fannie Mae. Lynch retired from active fund management in 1990 at age 46 to dedicate his time to family and philanthropy through the Lynch Foundation, leaving behind an institutional benchmark that modern portfolio managers still struggle to replicate.
The Peter Lynch Investment Strategy: How He Picked Multibaggers
The foundational pillar of the Peter Lynch strategy is “invest in what you know.” Lynch argued that an individual shopping at a local retail store or working in a specific trade often spots promising business trends months before Wall Street analysts notice them in quarterly filings.
However, many beginner investors misunderstand this rule. Lynch never suggested buying shares simply because you enjoy a company’s coffee or apparel. Ground-level scuttlebutt merely identifies the research lead; the investor must verify the company’s financial health, profit margins, and valuation before buying a single share.
The Six Categories of Stocks
Lynch categorized publicly traded companies into six distinct buckets, each requiring a different holding strategy and exit plan:
- Fast Growers: Small, aggressive enterprises growing earnings at 20% to 25% annually. These are the primary candidates for tenbaggers (stocks that rise 1,000%), but they carry high downside risk if growth decelerates.
- Stalwarts: Established multi-billion-dollar corporations compounding earnings reliably at 10% to 12% annually (such as major FMCG or consumer staples). They offer downside protection during market corrections.
- Slow Growers: Mature companies that grew rapidly in past decades and now pay generous dividends, typically growing roughly in line with national gross domestic product (GDP) at 2% to 4%.
- Cyclicals: Companies whose revenues and profits expand and contract in predictable patterns tied directly to macroeconomic cycles, such as automotive, steel, chemicals, and construction.
- Turnarounds: Depressed or bankrupt businesses capable of staging a sharp financial recovery, offering asymmetric upside completely decoupled from broader market direction.
- Asset Plays: Companies holding valuable unrecorded or undervalued assets (such as real estate, patents, or cash reserves) that the broader market has overlooked.
Lynch’s Six Stock Categories
| Category | Typical EPS Growth | Key Investment Objective | Primary Risk Factor |
|---|---|---|---|
| Fast Growers | 20%–25%+ | Exceptional capital appreciation (multibaggers) | Growth stall leads to severe multiple contraction |
| Stalwarts | 10%–12% | Moderate growth and portfolio stability | Overpaying during market euphoria |
| Slow Growers | 2%–4% | Regular dividend income and cash flow | Vulnerable to inflation and capital stagnation |
| Cyclicals | Highly variable | Tactical capital gains at cycle troughs | Mistiming entry near peak cyclical earnings |
| Turnarounds | Negative to positive | Asymmetric recovery returns | Potential total loss if restructuring fails |
| Asset Plays | Not growth-dependent | Unlocking balance sheet value | Value trap if management never monetizes assets |
Warning: Treating a cyclical business like a buy-and-hold stalwart is among the most expensive mistakes an investor can make; when industry supply catches up with demand, cyclical profits can collapse overnight.
Applying the PEG Ratio to Screen Growth
To avoid overpaying for fast-growing companies, Lynch pioneered the Price-to-Earnings Growth (PEG) ratio. Conventional price-to-earnings (PE) ratios fail when comparing companies expanding at different trajectories. By dividing the price multiple by the earnings growth rate, Lynch established a normalized valuation baseline.
PEG Ratio = PE Ratio ÷ Annual EPS Growth Rate
According to Lynch’s rule of thumb:
- A PEG ratio of 1.0 indicates a fairly valued company where the earnings growth rate matches the earnings multiple.
- A PEG ratio below 1.0 suggests a stock may be undervalued relative to its growth rate, representing a growth-at-a-reasonable-price candidate.
- A PEG ratio above 1.5 to 2.0 signals that expectations may be stretched, leaving little margin of safety if earnings fall short.
Investors must analyze the balance sheet alongside this ratio. A company boasting a favorable PEG ratio but burdened with high debt-to-equity leverage remains vulnerable during liquidity contractions.
The Fidelity Magellan Record: Lessons and Structural Context
Between 1977 and 1990, Lynch took Fidelity Magellan from a small, overlooked fund to the largest mutual fund on the planet. His performance outpaced virtually every institutional peer and established the benchmark against which modern equity funds are measured.
Historical Performance Overview (1977–1990)
| Metric | Fidelity Magellan Fund | S&P 500 Index |
|---|---|---|
| Compound Annual Growth Rate (CAGR) | 29.2% | 15.8% |
| Cumulative Total Return (Approx.) | ~2,700% | ~570% |
| Initial $10,000 Investment Value | ~$280,000 | ~$67,300 |
| Years Beating Benchmark | 11 of 13 years | Benchmark |
The Magellan Investor Return Paradox
Despite Lynch’s remarkable 29.2% CAGR, internal Fidelity studies revealed an uncomfortable reality: the average individual investor in the Magellan Fund earned substantially less than the fund’s published return, with many losing money over their holding period.
This performance gap occurred because investors frequently engaged in emotional market timing. They poured capital into Magellan after a quarter of stellar outperformance, then redeemed their units during intermediate pullbacks and market downturns. Lynch’s record proves that even the most lucrative investment strategy fails to protect investors who lack the emotional discipline to endure unavoidable drawdowns.
Essential Peter Lynch Books for Every Investor
Peter Lynch authored three foundational books that transformed retail investing literature, translating institutional portfolio techniques into accessible, plain-English guides.
- One Up On Wall Street (1989): How to spot stocks using everyday observation. Lynch’s definitive work outlines how retail investors can spot multibaggers in everyday life. The book details his six-category classification system, the two-minute stock pitch, and common Wall Street myths that hold individual investors back.
- Beating the Street (1993): Real case studies behind Lynch’s biggest stock picks. A practical companion that provides a step-by-step account of how Lynch actually constructed and managed the Magellan portfolio. It introduces his 21 investment principles, covering mutual fund selection and real-world company analysis across retail, utilities, and banking.
- Learn to Earn (1995): A beginner’s primer on investing basics. Written with John Rothchild for younger audiences and absolute beginners, this book explains the fundamentals of capitalism, corporate structure, basic accounting, and the long-term wealth-building power of the stock market.
Applying Peter Lynch’s Principles to Indian Equity Markets
Applying Lynch’s bottom-up investing strategy within India’s capital markets requires tailoring his methods to local regulatory and disclosure standards. The Securities and Exchange Board of India (SEBI) mandates detailed corporate disclosures that retail investors can use to verify ground-level observations.
Local Scuttlebutt on Indian Exchanges
Indian investors have exceptional visibility into ground-level consumer trends across fast-moving consumer goods (FMCG), retail banking, two-wheeler automotive manufacturers, and organized retail chains. When a consumer observes sustained footfall in domestic retail outlets or notices a specific hospital chain opening new centers, that observation can serve as an initial thesis.
Investors should verify this initial thesis on the National Stock Exchange (NSE) by reviewing quarterly earnings reports, revenue growth, and statutory filings required under the SEBI (Listing Obligations and Disclosure Requirements) Regulations, 2015.
Tip: Cross-check ground-level consumer excitement against a company’s debt-to-equity ratio and free cash flow before making an allocation, as rising sales mean very little if high interest expenses consume operating margins.
Navigating Indian Market Traps
While Lynch’s GARP methodology aligns well with India’s expanding domestic economy, several structural risks require discipline:
- Cyclical and Commodity Traps: Indian metal, sugar, and real estate stocks regularly report astronomical quarterly earnings growth near the peak of a commodity cycle, creating deceptively low P/E ratio. Purchasing these companies at cyclical peaks often results in severe, multi-year portfolio drawdowns.
- Valuation Stretches in Fast Growers: Due to high institutional and retail inflows, high-growth mid-cap and small-cap stocks on domestic exchanges frequently trade at PEG ratios well above 2.5 or 3.0. Lynch’s framework cautions against chasing momentum when valuations detach from realistic earnings expansion.
- Accounting and Corporate Governance Checks: Ground-level popularity does not eliminate governance risk. Investors must examine auditor remarks, promoter pledging, and cash collection cycles rather than relying solely on brand recognition.
Monetyra’s Take: Peter Lynch’s philosophy remains one of the most practical blueprints for retail equity investors in India, but it is frequently abused by those who skip fundamental verification. Spotting an overcrowded store is an observation, not an investment thesis. In our assessment, Lynch’s framework delivers the greatest edge when applied to consumer-facing stalwarts and fast growers where verified earnings per share expansion is supported by clean accounting, minimal debt, and disciplined entry multiples below excessive PEG thresholds.
Conclusion
Peter Lynch demystified equity investing by proving that thorough, ground-level research combined with elementary valuation metrics can outperform institutional financial engineering. His thirteen-year run at the Magellan Fund remains a masterclass in Growth at a Reasonable Price, stock classification, and emotional resilience. For modern retail investors, Lynch’s legacy serves as an enduring reminder that financial markets reward patient business analysis, independent observation, and disciplined capital allocation.
Master the strategies of iconic investors who beat the markets.
FAQs
Peter Lynch is an American investor, mutual fund manager, and author best known for running Fidelity Investments’ Magellan Fund from 1977 to 1990. During his tenure, he achieved a 29.2% compound annual return, outperforming the S&P 500 in 11 out of 13 years and establishing himself as one of the most successful fund managers in market history.
Begin with One Up On Wall Street (1989), which details his retail investing philosophy and stock categories in straightforward language. Follow it with Beating the Street (1993) for practical portfolio management case studies, and Learn to Earn (1995) if you want a complete introduction to corporate fundamentals and economic concepts.
Lynch’s core strategy is Growth at a Reasonable Price (GARP). It combines everyday ground-level observation (“invest in what you know”) with fundamental analysis. He categorizes stocks into six groups, uses the PEG ratio to prevent overpaying for growth, and holds companies whose earnings expansion is backed by manageable debt and strong operating cash flow.
Peter Lynch delivered an average compound annual growth rate of 29.2% from 1977 until his retirement in 1990. Under his management, the Magellan Fund grew from approximately $18 million in assets to over $14 billion, handily beating the broader S&P 500 benchmark’s 15.8% return over the same period.
According to Peter Lynch, a PEG ratio of 1.0 represents fair value, where the company’s price-to-earnings multiple matches its annual percentage earnings growth rate. A PEG ratio below 1.0 suggests an undervalued opportunity with an attractive margin of safety, while a ratio exceeding 1.5 to 2.0 indicates that the stock may be overvalued relative to its realistic growth prospects.
Yes. While modern markets feature algorithmic execution and faster information dissemination, Lynch’s core tenets—analyzing balance sheets, avoiding overhyped momentum stocks, understanding business models, and maintaining long-term holding discipline—remain timeless principles for individual equity investors navigating both global and Indian markets.
Disclaimer: This article was written with the help of AI and reviewed by Monetyra’s editorial team. It is for educational purposes only and should not be considered financial advice. Trading and investing in financial instruments involve significant risk of loss and are not suitable for all investors, and past performance of any strategy does not guarantee future results. Please consult a licensed financial advisor before making any investment or trading decision.
In India, equity investments are regulated by the Securities and Exchange Board of India (SEBI). Readers are advised to verify the regulatory status of their intermediary and ensure compliance with applicable Indian securities laws before investing.