Fear and Greed Index India: Meaning, Calculation & Usage
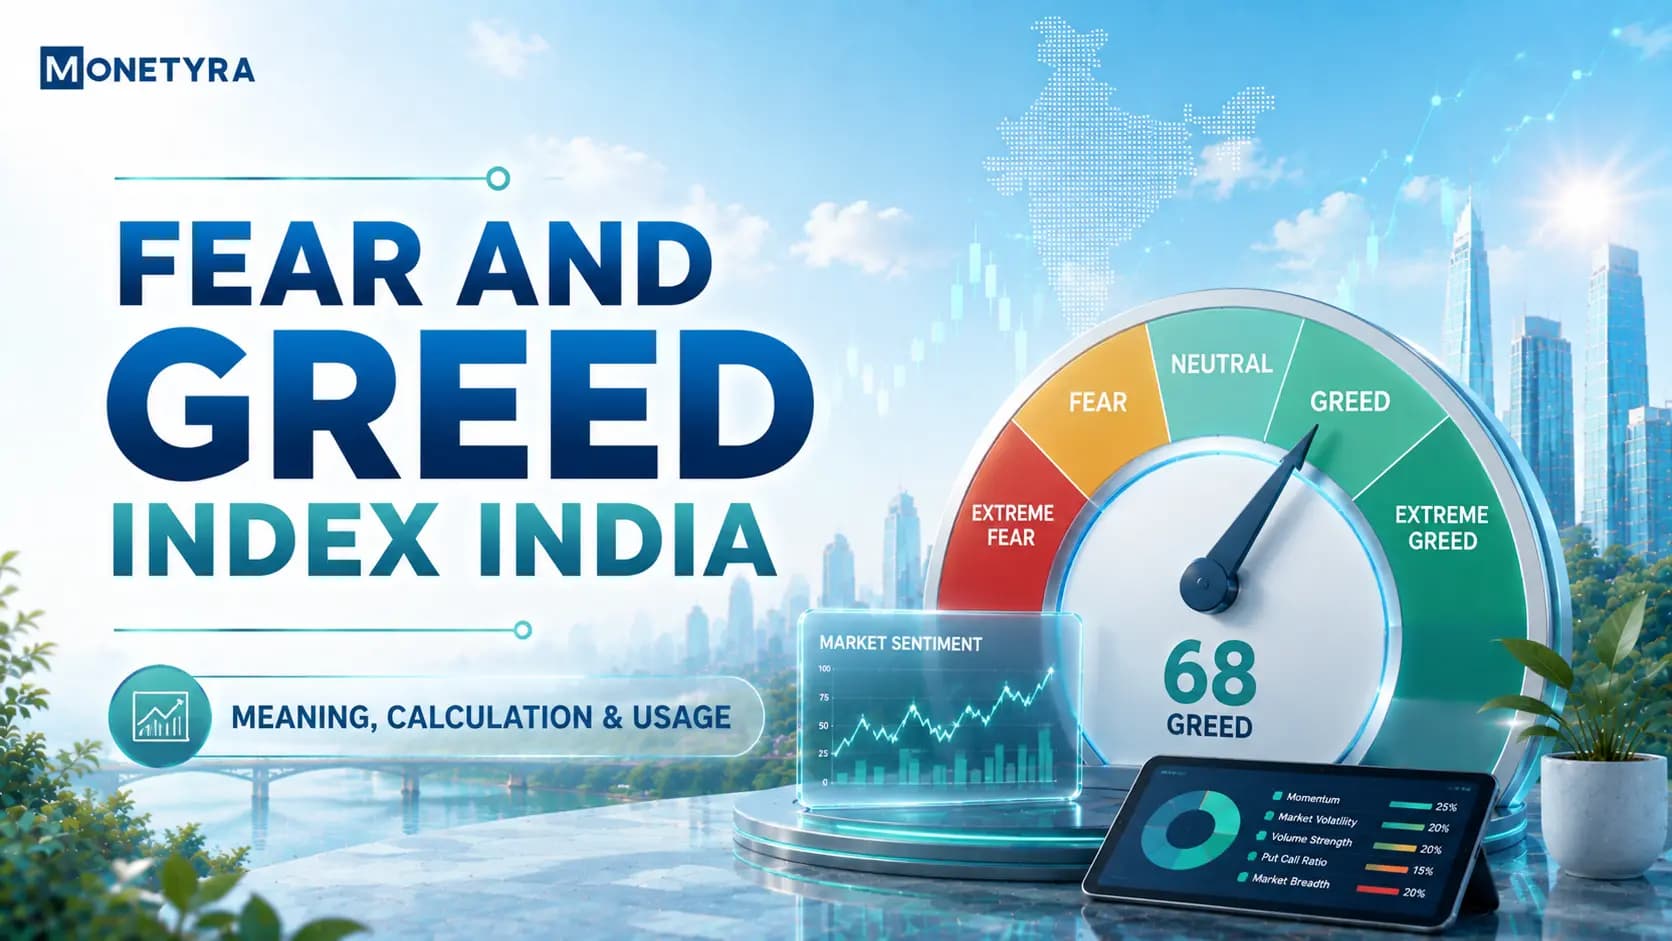
Stock market prices do not move on corporate fundamentals and economic earnings data alone; investor emotion plays an equally significant role in driving short-term asset prices. During strong equity rallies, the fear of missing out (FOMO) often pushes stock valuations well above intrinsic values, while market panics trigger irrational sell-offs that depress equity prices.
To quantify these emotional swings across the Indian stock market, financial analysts track sentiment tools such as Tickertape’s Market Mood Index (MMI)—commonly referred to as a fear and greed index for the Indian stock market. By measuring aggregate market mood on a daily basis, this independent, third-party sentiment indicator helps retail investors identify market extremes and manage equity portfolios with discipline.
Quick Takeaways
- Core Definition: The fear and greed index india is a composite sentiment indicator that measures investor emotion across Indian equities on a 0 to 100 scale, ranging from Extreme Fear to Extreme Greed.
- Primary Mechanism: The index aggregates multiple market inputs—including price momentum, market breadth, volatility, option put-call ratios, and foreign institutional investor (FII) order flow—to gauge whether the market is overbought or oversold.
- Primary Risk / Limit: Sentiment indicators measure prevailing market mood rather than structural market valuation; equity markets can remain in extreme fear or extreme greed zones longer than expected during strong macro trends.
What Is the Fear and Greed Index for Indian Stock Market?
Tools like Tickertape’s Market Mood Index provide a single numeric reading from 0 to 100 to summarize overall investor psychology across the National Stock Exchange (NSE) and Bombay Stock Exchange (BSE). Note that this is an independent analytical tool—not an index published or endorsed by NSE, BSE, or SEBI.
- 0 to 30 (Extreme Fear): Market participants exhibit intense anxiety, often dumping stocks indiscriminately during market sell-offs.
- 31 to 50 (Fear): Caution dominates the market, leading to subdued trading volume and defensive asset positioning.
- 51 to 70 (Greed): Optimism builds, leading to increased buying activity and expanding valuation multiples.
- 71 to 100 (Extreme Greed): Euphoria peaks as retail and institutional investors aggressively chase momentum, elevating the risk of a sharp market correction.
Understanding market sentiment allows contrarian investors to follow Warren Buffett’s classic principle: being fearful when others are greedy, and greedy when others are fearful.
Tips: Always cross-reference extreme sentiment readings with broad market valuation metrics—such as the Nifty PE Ratio—to ensure price pullbacks reflect emotional panics rather than deteriorating corporate earnings.
How Is the Fear and Greed Index Calculated in India?
To understand how market providers calculate the market mood index india, investors must look at the key market sub-indicators combined into the composite metric.
- Market Momentum: Measures the performance of the benchmark Nifty 50 index relative to its 50-day and 200-day moving averages.
- Market Breadth: Evaluates market participation using the Advance Decline Ratio to see if price moves are broad-based or driven by a few heavyweight stocks.
- Market Volatility: Tracks implied volatility through India VIX; rising volatility indicates fear, while declining volatility points to market complacency.
- Options Order Flow (Put-Call Ratio): Compares derivative trading volume across Nifty call options and put options to gauge institutional downside hedging demand.
- Institutional Liquidity Flows: Measures foreign institutional investor (FII) and domestic institutional investor (DII) net buying or selling in the cash equity segment.
- Price Strength: Tracks the ratio of listed stocks reaching 52-week highs versus those hitting 52-week lows on the NSE.
The plain-text formula representing this weighted aggregation is:
Market Mood Index (MMI) ≈ Weighted Sum of (Market Momentum + Breadth + India VIX + Put-Call Ratio + Institutional Flows + Price Strength)
| Sentiment Zone | Index Score | Prevailing Market Behavior | Strategic Investor Action |
|---|---|---|---|
| Extreme Fear | 0 to 30 | Panic selling, widespread pessimism, high volatility | Evaluate quality equities for phased lump-sum buying or accelerated SIP deployment. |
| Fear | 31 to 50 | Subdued volume, cautious accumulation | Continue disciplined monthly SIP contributions. |
| Greed | 51 to 70 | Bullish expansion, rising retail participation | Rebalance portfolios by trimming overweight equity exposure. |
| Extreme Greed | 71 to 100 | Euphoria, aggressive leverage, stretched multiples | Avoid lump-sum purchases; take partial profits and build cash reserves. |
Warning: Relying strictly on sentiment readings without verifying underlying balance sheets can expose investors to severe drawdowns during structural economic downturns.
India VIX vs Fear and Greed Index: Key Differences
Investors often compare the India VIX against the Fear and Greed Index. While both track market risk and investor emotion, their underlying methodologies differ.
| Feature | India VIX | Fear and Greed Index |
|---|---|---|
| Primary Scope | Measures expected 30-day market volatility only | Multi-factor index measuring overall market sentiment |
| Primary Input | Out-of-the-money Nifty 50 option bid-ask order books | Composite metric combining momentum, breadth, VIX, FII flows, and PCR |
| Scale & Reading | Annualized percentage figure (e.g., 15.5%) | Single normalized score from 0 to 100 |
| Directional Bias | Non-directional (spikes during market drops, falls during steady rallies) | Directional spectrum (Extreme Fear at 0 to Extreme Greed at 100) |
Traders also track high-value institutional trades using NSE Bulk Deals data to see if major funds are buying or selling during extreme sentiment readings.
Using the Index for SIP and Asset Allocation Strategies
Contrarian investors use sentiment readings to refine their systematic investment plans (SIPs) and capital allocation decisions.
- Managing High Greed (>80): When the index enters Extreme Greed, retail investors should avoid deploying large lump-sum capital. Instead, maintain regular SIPs and rebalance portfolios by moving excess profits into fixed income.
- Navigating Extreme Fear (<20): Periods of Extreme Fear often coincide with market sell-offs that lower stock prices below intrinsic value. Long-term investors can use these windows to increase SIP amounts or deploy phased lump-sum investments into quality index funds or small-cap funds.
- Evaluating Small-Cap Heat: Cross-referencing sentiment scores with specialized valuation metrics like the Nifty Smallcap 250 PE Ratio prevents investors from buying small-cap equities at peak valuations.
- Understanding Pullbacks: When market drawdowns occur alongside extreme fear, understanding the nature of a market correction helps investors stay calm rather than panic-selling equity funds.
Regulatory Framework and SEBI Guidelines
In India, equity markets and investment advisory services operate under strict rules enforced by the Securities and Exchange Board of India (SEBI).
Under SEBI regulations, third-party sentiment tools and market indicators serve as educational analysis tools. Registered Research Analysts and Investment Advisors must comply with SEBI disclosure norms when issuing market research or portfolio advice based on sentiment indicators.
Conclusion
The fear and greed index india provides retail investors with a reliable framework for understanding market sentiment and investor psychology. By identifying extreme fear and extreme greed environments, investors can make disciplined asset allocation decisions, avoid emotional panic selling, and stick to long-term wealth creation plans.
Deepen your portfolio knowledge with data-led macro analysis and strategic allocation guides.
FAQs
The Fear and Greed Index for the Indian stock market is a sentiment indicator scoring market emotion from 0 (Extreme Fear) to 100 (Extreme Greed) using equity, options, and volume data.
Market providers calculate the index by weighting multiple sub-indicators, including price momentum, advance-decline market breadth, India VIX volatility, put-call option ratios, and FII/DII institutional net flows.
A high reading above 80 indicates Extreme Greed in the Nifty 50, signaling overbought market conditions, elevated valuation multiples, and an increased risk of a price correction.
Historically, Extreme Fear readings below 20 signal high market panic where quality stocks often trade at discounted valuations, offering favorable entry opportunities for long-term investors.
Investors can maintain standard monthly SIPs during neutral zones, increase SIP allocations or deploy lump-sum capital during Extreme Fear, and trim equity allocations during Extreme Greed.
India VIX measures 30-day expected market volatility derived from Nifty option prices, while the Fear and Greed Index is a multi-factor indicator measuring overall market mood across multiple indicators.
Disclaimer: This article was written with the help of AI and reviewed by the Monetyra editorial team. It is for educational purposes only and should not be considered financial advice. Trading and investing in financial instruments involve significant risk of loss and are not suitable for all investors, and past performance of any strategy does not guarantee future results. Please consult a licensed financial advisor before making any investment or trading decision.
In India, equity trading and market disclosures are regulated by SEBI. Readers are advised to verify market sentiment metrics and regulatory disclosures on official exchange portals before making investment decisions.