India VIX Calculator: Formula and Nifty Range Guide
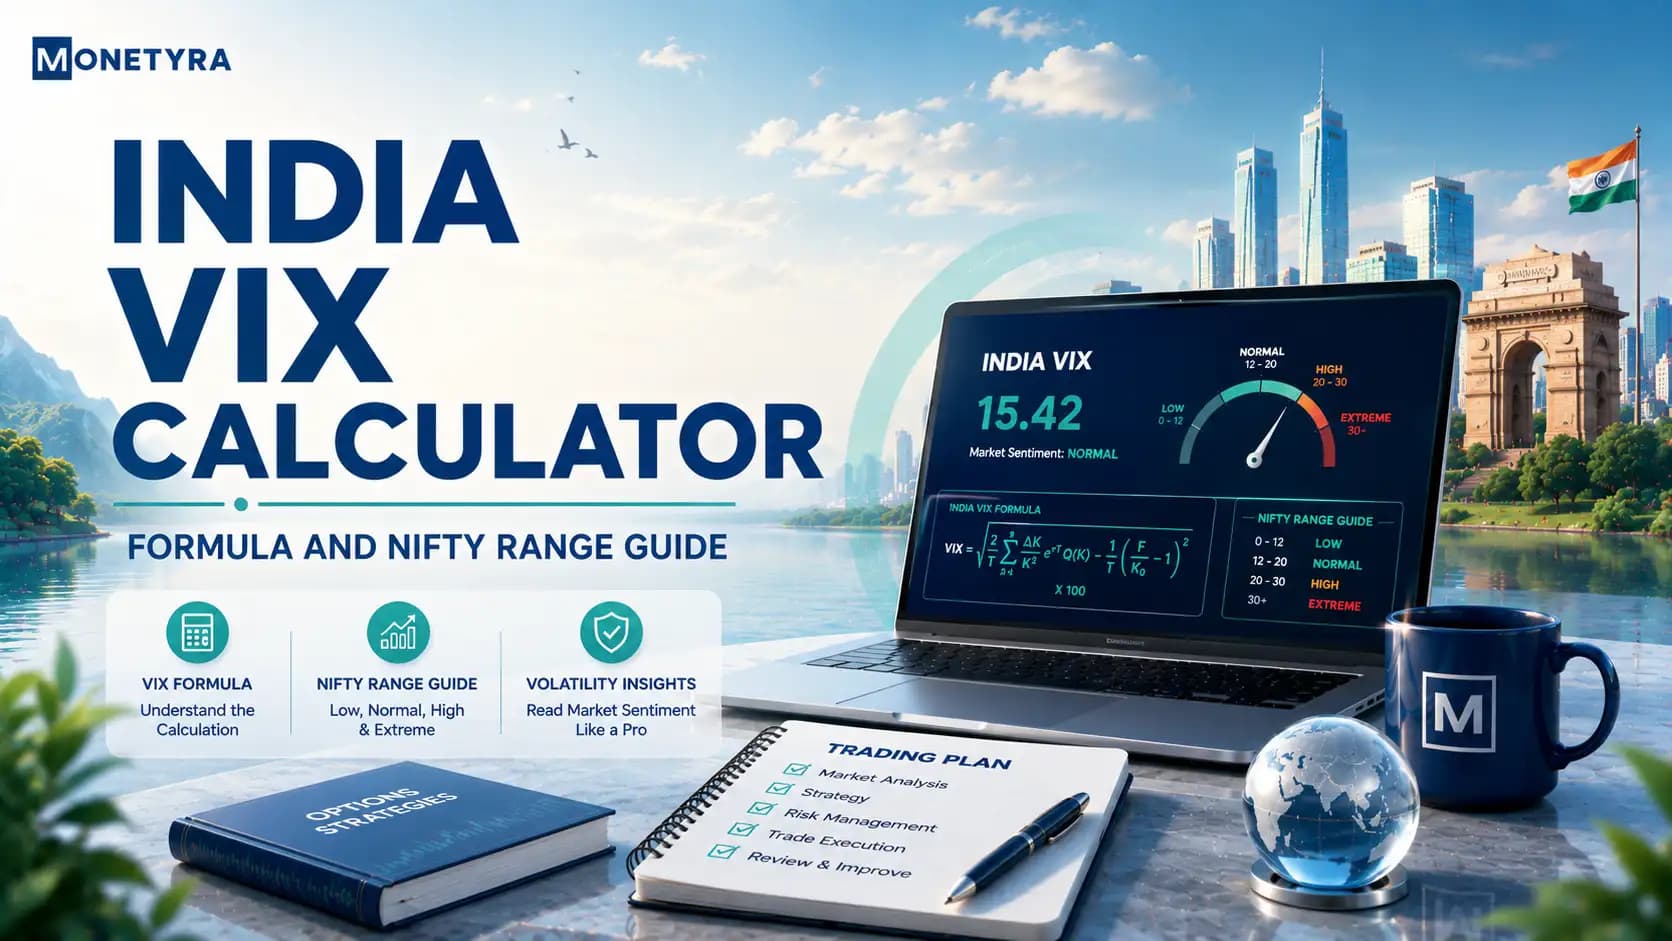
An India VIX calculator processes live Nifty 50 out-of-the-money (OTM) call and put option prices to determine implied market volatility. Using the Black-Scholes model and CBOE computation methodology tailored for the National Stock Exchange (NSE), this tool calculates expected percentage movements over a 30-day horizon. Traders use it to translate raw VIX readings into concrete daily or monthly price ranges for the Nifty index.
Quick Takeaways
- An india vix calculator converts the annualized volatility published by the exchange into actionable daily and monthly expected price ranges for the Nifty 50 index.
- Derived from out-of-the-money Nifty option order books, India VIX measures expected 30-day market volatility rather than directional market movement.
- Incorporating volatility calculations into risk management allows options traders to adjust position sizing, hedge tail risk, and anticipate margin expansion.
What Is India VIX and How Does It Work?
The India VIX is a volatility index calculated and published by the National Stock Exchange (NSE) that measures the market’s expectation of price fluctuation over the upcoming 30 calendar days, expressed as an annualized percentage.
Unlike directional stock indices such as the Nifty 50 or Sensex, India VIX is a non-directional metric representing expected variance. Higher index values signify expectations of wider price swings, while lower values reflect anticipated market stability.
When analyzing broader equity conditions, analysts often evaluate volatility trends alongside valuation tools such as the nifty pe ratio or breadth metrics like the Advance Decline Ratio to contextualize market corrections. Understanding what is india vix provides institutional and retail traders with an objective measure of market anxiety and option pricing environment.
Tips: Remember that India VIX reflects expected price magnitude, not direction; the index can spike during sharp upward rallies as well as during sudden market declines.
Mathematical Mechanics: The India VIX Calculation Formula
The official india vix calculation formula utilizes a model-free volatility computation framework derived from the order book prices of out-of-the-money (OTM) Nifty 50 option contracts.
The exchange aggregates bid and ask quotes across current-month and near-month Nifty call and put options to compute implied variance. Because the published India VIX figure represents annualized volatility, market participants utilize a standard square-root conversion rule to determine short-term trading bands.
Annualized to Daily Volatility Formula
To convert the annual VIX figure into an estimated 1-day percentage movement for the Nifty 50 index, divide the VIX reading by the square root of the annual trading days (typically 252) :
Daily Volatility (%) = India VIX ÷ √252
Using √252 ≈ 15.87, the formula simplifies to dividing the VIX number by 15.87. Alternatively, some risk models use calendar days (√365 ≈ 19.10) for weekend-inclusive variance modeling.
30-Day Expected Movement Formula
To estimate the expected percentage movement over the next 30 calendar days, divide the VIX figure by the square root of 12 months (√12 ≈ 3.46):
Monthly Volatility (%) = India VIX ÷ √12
India VIX Annual Percentage → Square-Root Time Conversion → Daily & Monthly Nifty Bands
How to Use an India VIX Calculator to Estimate Nifty Range
Applying an india vix calculator framework allows traders to construct statistical upper and lower boundary levels for the Nifty 50.
Step-by-Step Worked Example
Assume the Nifty 50 index is currently trading at 25,000 and the published India VIX is 16.00%:
- Calculate Daily Percentage Move: 16.00 ÷ 15.87 = 1.008%
- Calculate Daily Point Range: 25,000 × 1.008% = ±252 points
- Establish Daily Range: Expected lower band is 24,748; expected upper band is 25,252
- Calculate Monthly Percentage Move: 16.00 ÷ 3.46 = 4.62%
- Calculate Monthly Point Range: 25,000 × 4.62% = ±1,155 points
| India VIX Reading | Expected Daily Move (%) | Expected Daily Range (Nifty @ 25,000) | Expected Monthly Move (%) | Expected Monthly Range (Nifty @ 25,000) |
|---|---|---|---|---|
| 12.00% | ±0.76% | ±190 points | ±3.46% | ±865 points |
| 16.00% | ±1.01% | ±252 points | ±4.62% | ±1,155 points |
| 20.00% | ±1.26% | ±315 points | ±5.77% | ±1,442 points |
| 25.00% | ±1.58% | ±394 points | ±7.22% | ±1,805 points |
Interpreting High vs. Low VIX Regimes
Understanding historical volatility regimes helps investors contextualize overall market sentiment and price behavior.
- Low VIX Regimes (Under 13–14): Indicate market stability and investor confidence, often accompanied by steady upward trends, lower option purchasing premiums, and narrower intraday candle ranges. However, prolonged low VIX levels can signal market complacency prior to a Market Correction Meaning.
- Moderate VIX Regimes (14–18): Represent historical baseline volatility in Indian equity markets, providing balanced option premium pricing and standard daily ranges.
- High VIX Regimes (Above 20–25): Reflect heightened uncertainty, sharp price swings, and rapid option premium expansion. Extremely high VIX readings frequently coincide with major economic announcements, geopolitical events, or broader market panics.
Warning: High volatility environments increase execution risks such as slippage and rapid margin expansion; position sizes should be scaled down accordingly.
Impact on Option Premiums, Margins, and Execution Drag
Volatility metrics directly influence options pricing through the Vega Greek component. When India VIX expands, option premiums across both call and put strikes increase, even if the underlying Nifty index price remains unchanged.
Regulatory risk disclosures published by the Securities and Exchange Board of India (SEBI) highlight that over 85% of individual retail derivative traders incur net financial losses. Misjudging volatility changes—such as buying options during peak VIX levels only to suffer from subsequent “volatility crush”—is a major contributor to capital depletion.
Additionally, exchange-mandated SPAN and Exposure margins automatically increase during high VIX regimes to protect clearing corporations against counterparty default, reducing available leverage for intraday position traders.
Volatility Context: Combining India VIX with Market Metrics
To build a robust risk management framework, institutional market participants evaluate India VIX alongside systemic market controls such as exchange Circuit Breaker Stock Market thresholds.
Key Analytical Limitations
- Non-Directional Bias: VIX measures movement magnitude, not trend direction.
- Mean-Reverting Nature: Extreme VIX readings tend to revert toward historical averages over time.
- Non-Tradeable Instrument: Unlike index futures, retail traders in India cannot directly buy or sell spot India VIX on domestic exchanges; risk must be managed indirectly via options or Nifty futures.
Conclusion
Utilizing an india vix calculator provides retail investors and derivative traders with a mathematical method for establishing Nifty 50 statistical price bands. By converting annualized volatility metrics into concrete daily and monthly expectations, market participants can adjust position sizing, manage option premium risks, and protect capital across varying market environments.
Master quantitative volatility metrics, options pricing frameworks, and SEBI-aligned risk controls tailored for Indian equity markets.
FAQs
India VIX is computed by the National Stock Exchange (NSE) using a model-free formula that aggregates bid and ask prices of out-of-the-money Nifty call and put options to determine expected 30-day volatility.
To find the estimated daily percentage movement, divide the India VIX reading by the square root of annual trading days (√252 ≈ 15.87).
A low VIX (below 13–14) suggests low expected volatility and narrow price ranges, while a high VIX (above 20) indicates expected wide price fluctuations and market uncertainty.
Rising VIX increases option premiums due to higher Vega pricing and leads domestic exchanges to raise intraday SPAN and Exposure margin requirements.
India VIX does not predict the exact timing or direction of market crashes; it measures the market’s current expectation of prospective 30-day price volatility.
No, spot India VIX cannot be traded directly by retail investors on Indian exchanges; traders manage volatility exposure using Nifty index options or futures contracts.
Disclaimer: This article was written with the help of AI and reviewed by the Monetyra editorial team. It is for educational purposes only and should not be considered financial advice. Trading and investing in financial instruments involve significant risk of loss and are not suitable for all investors, and past performance of any strategy does not guarantee future results. Please consult a licensed financial advisor before making any investment or trading decision.
In India, equity and derivative markets are regulated by the Securities and Exchange Board of India (SEBI). Readers are urged to review official SEBI risk disclosures regarding F&O trading before deploying capital.