Market Breadth: Definition, Indicators, and Trading Usage
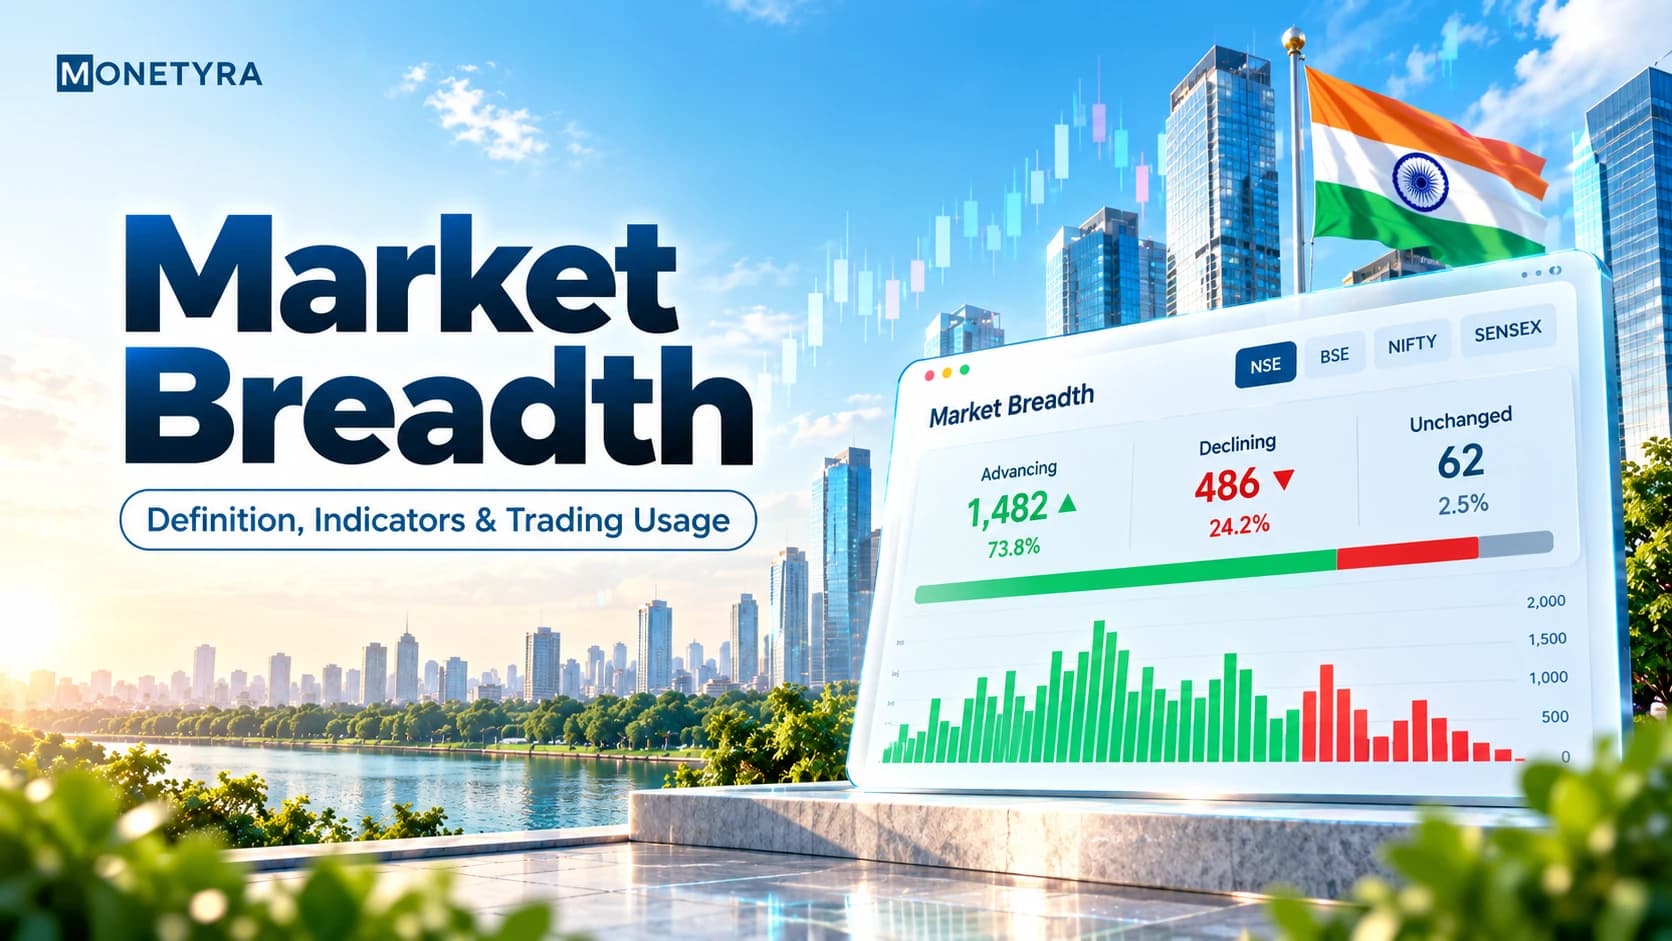
Headline index gains can be deeply deceiving. When the Nifty 50 or Sensex hits a record high, it is easy to assume the entire market is booming. However, index-level rallies are frequently carried by just a handful of heavyweights—such as Reliance Industries, TCS, or HDFC Bank—while the broader market quietly collapses. This hidden structural imbalance is precisely why technical analysts turn to market breadth. This measures the total number of stocks actively participating in a price movement, revealing whether a market trend represents genuine broad-based strength or fragile heavyweight concentration.
Quick Takeaways
- Market breadth is a technical analysis concept that evaluates broad market health by measuring the ratio or count of advancing stocks relative to declining stocks.
- Diagnostic Power: Tracking breadth indicators helps investors identify price-breadth divergences, warning of impending market corrections before headline indices drop.
- Practical Application: Analysts use metrics like the Advance-Decline Ratio and percentage of stocks above key moving averages to confirm breakout validity and manage risk.
What Is Market Breadth?
It is a technical analysis metric that measures the underlying level of participation across listed equities within a specific market index or exchange.
Rather than focusing solely on price direction or index points, breadth analysis evaluates the internal health of the market. For example, if the Nifty 50 moves up by 150 points on a given trading session, looking at price alone does not tell you if 45 stocks advanced or if only 5 mega-cap heavyweights dragged the entire index upward while 45 stocks fell.
Understanding breadth indicators requires distinguishing between two distinct structural market conditions:
- Broad-based rally: A healthy, sustainable bull move where midcap, smallcap, and large-cap stocks advance together across various sectors.
- Narrow market rally: An unsustainable move where headline indices hit new highs powered purely by top-weighted stocks, hiding broad underlying weakness.
Tip: Always cross-check headline index breakouts against midcap and smallcap broad market indices to verify structural participation.
Why Market Breadth Matters for Portfolio Management
Relying exclusively on market-cap weighted indices introduces significant concentration risk into portfolio management. Because top-weighted stocks exert a disproportionate influence on indices like the Nifty 50, index movements can completely mask distribution occurring across broader sectors.
Analyzing this indicator serves three core tactical functions:
- Divergence Identification: When headline indices reach new high levels while market breadth indicators make lower highs, institutional capital is typically distributing shares, signaling an impending market correction.
- Avoiding False Breakouts: Retail traders frequently get caught in bull traps when chasing market breakouts that lack broad volume and stock participation.
- Evaluating Institutional Liquidity: Strong breadth indicates widespread institutional buying across multiple sectors, confirming healthy market liquidity.
Warning: Buying broad index breakouts when overall market participation is making lower lows exposes your capital to sharp, unexpected reversal risks.
Key Indicators to Track
Traders and analysts rely on several core market breadth indicators to evaluate internal market participation.
Advance-Decline (A/D) Line
Looking for a running scorecard of market health? The Advance-Decline Line gives you exactly that — it tracks, day by day, whether more stocks are advancing or declining.
A/D Line = Previous A/D Line Value + (Number of Advancing Stocks – Number of Declining Stocks)
When the A/D Line trends upward alongside price indices, it confirms healthy market participation.
Advance-Decline (A/D) Ratio
The advance decline ratio measures the direct proportion of advancing stocks compared to declining stocks for a specific session.
Advance-Decline Ratio = Total Advancing Stocks ÷ Total Declining Stocks
An A/D Ratio greater than 1.0 signifies bullish market internals, whereas a ratio below 1.0 indicates bearish sentiment.
Percentage of Stocks Above Moving Averages
This structural metric tracks the proportion of stocks within a broad index (such as the NSE 500) trading above key Simple Moving Averages (SMA), such as the 50-day or 200-day SMA.
Percentage Above 200 SMA = (Number of Stocks Above 200 SMA ÷ Total Index Stocks) × 100
McClellan Oscillator
The McClellan Oscillator measures breadth momentum by calculating the difference between two exponential moving averages (typically 19-day and 39-day) of net advancing stocks.
| Indicator Name | Primary Formula | Bullish Signal | Bearish Signal | Primary Tactical Application |
|---|---|---|---|---|
| A/D Line | Cumulative Net Advances | Rising alongside index | Falling while index rises | Long-term trend confirmation |
| A/D Ratio | Advancing Stocks ÷ Declining Stocks | Ratio > 1.5 | Ratio < 0.7 | Daily market sentiment measurement |
| % Above 200 SMA | (Stocks > 200 SMA ÷ Total) × 100 | Reading > 70% | Reading < 30% | Structural bull/bear evaluation |
| McClellan Oscillator | 19-day EMA – 39-day EMA (Net Advances) | Cross above 0 line | Cross below 0 line | Short-term momentum & overbought conditions |
Reading Real-Time Market Breadth Signals
Evaluating market breadth today requires looking beyond daily absolute numbers and focusing on multi-day trend relationships between breadth metrics and index prices.
Positive Market Breadth
This positive signal occurs when advancing stocks consistently outnumber declining stocks as headline indices rise. When higher index prices are accompanied by a rising A/D Line and strong expansion in advancing volume, it indicates strong institutional accumulation across large-cap, midcap, and small-cap segments.
Negative Market Breadth
This negative signal occurs when declining issues outnumber advancing issues. If an index drops and declining volume surges, it confirms widespread liquidation. However, the most critical signal is when headline indices move flat or slightly higher while breadth turns sharply negative—a classic warning sign that institutional investors are exiting under the cover of index heavyweights.
Spotting Breadth Divergence
Breadth divergence provides powerful leading signals for swing traders and long-term investors:
- Bearish Divergence: The Nifty 50 makes a fresh higher high, but the Advance-Decline Line makes a lower high. This divergence indicates that fewer stocks are supporting the rally, frequently preceding a sharp index pullback.
- Bullish Divergence: The headline index hits a new low, but the A/D Line forms a higher low. This indicates underlying accumulation across broader stocks before index-level confirmation occurs.
Measuring Market Breadth on the NSE and BSE
In the Indian financial landscape, tracking market breadth requires analyzing broad exchange-level data published daily by the National Stock Exchange (NSE) and Bombay Stock Exchange (BSE).
Evaluating breadth purely on the Nifty 50 can be misleading because 50 stocks represent a narrow sample. Instead, market participants track breadth indicators across broader Indian market indices:
- NSE 500 & Nifty Total Market: Offers the most comprehensive picture of market participation across large, mid, and small-cap companies.
- Nifty Midcap 150 & Smallcap 250: Tracking A/D ratios within these indices reveals risk-on or risk-off sentiment among domestic retail and HNI investors.
- SEBI Market Data Reporting: Market depth, block deal data, and daily advance-decline summary figures are published daily post-market close under regulations overseen by the Securities and Exchange Board of India (SEBI).
Market breadth indicators should always be combined with valuation context—such as the Nifty PE Ratio—and volatility metrics like India VIX to gain a holistic view of current market health.
Conclusion
Market breadth provides the internal diagnostic lens required to see past headline index illusions. By tracking metrics such as the Advance-Decline Ratio, cumulative A/D Line, and moving average participation percentages, investors can distinguish between broad, sustainable bull markets and fragile, heavyweight-driven rallies. Incorporating market internals analysis into your daily market framework helps protect capital against false breakouts and ensures your portfolio remains aligned with true institutional capital flows.
Uncover institutional trends and macroeconomic shifts with Monetyra’s analytical insights.
FAQs
It is a technical metric that measures the number of stocks participating in an overall market movement. It assesses market health by analyzing advancing versus declining stocks.
The Advance-Decline (A/D) Line and the Advance-Decline Ratio are considered two of the most effective indicators for tracking structural market health and daily participation.
It is calculated by dividing the total number of advancing stocks by the total number of declining stocks for a given trading session (A/D Ratio = Advancing Stocks ÷ Declining Stocks).
It means that more stocks are declining in price than advancing. It indicates selling pressure across the broader market, even if headline indices remain flat or positive.
Yes, it often acts as a leading indicator. Breadth divergences—where market participation weakens while price indices continue rising—frequently predict major market tops and corrections before price index pullbacks begin.
They are measured by tracking daily advancing and declining counts across exchange-listed stocks and broad indices like the NSE 500, Nifty Midcap 150, and Nifty Smallcap 250.
Disclaimer: This article was written with the help of AI and reviewed by the Monetyra editorial team. It is for educational purposes only and should not be considered financial advice. Trading and investing in financial instruments involve significant risk of loss and are not suitable for all investors. Please consult a licensed financial advisor before making any investment or trading decision.
In India, equity markets are regulated by SEBI. Readers are advised to verify the regulatory status of their broker/fund house and ensure compliance with applicable Indian laws before investing.