Yield Curve Inversion: Macro Risk & Portfolio Strategy
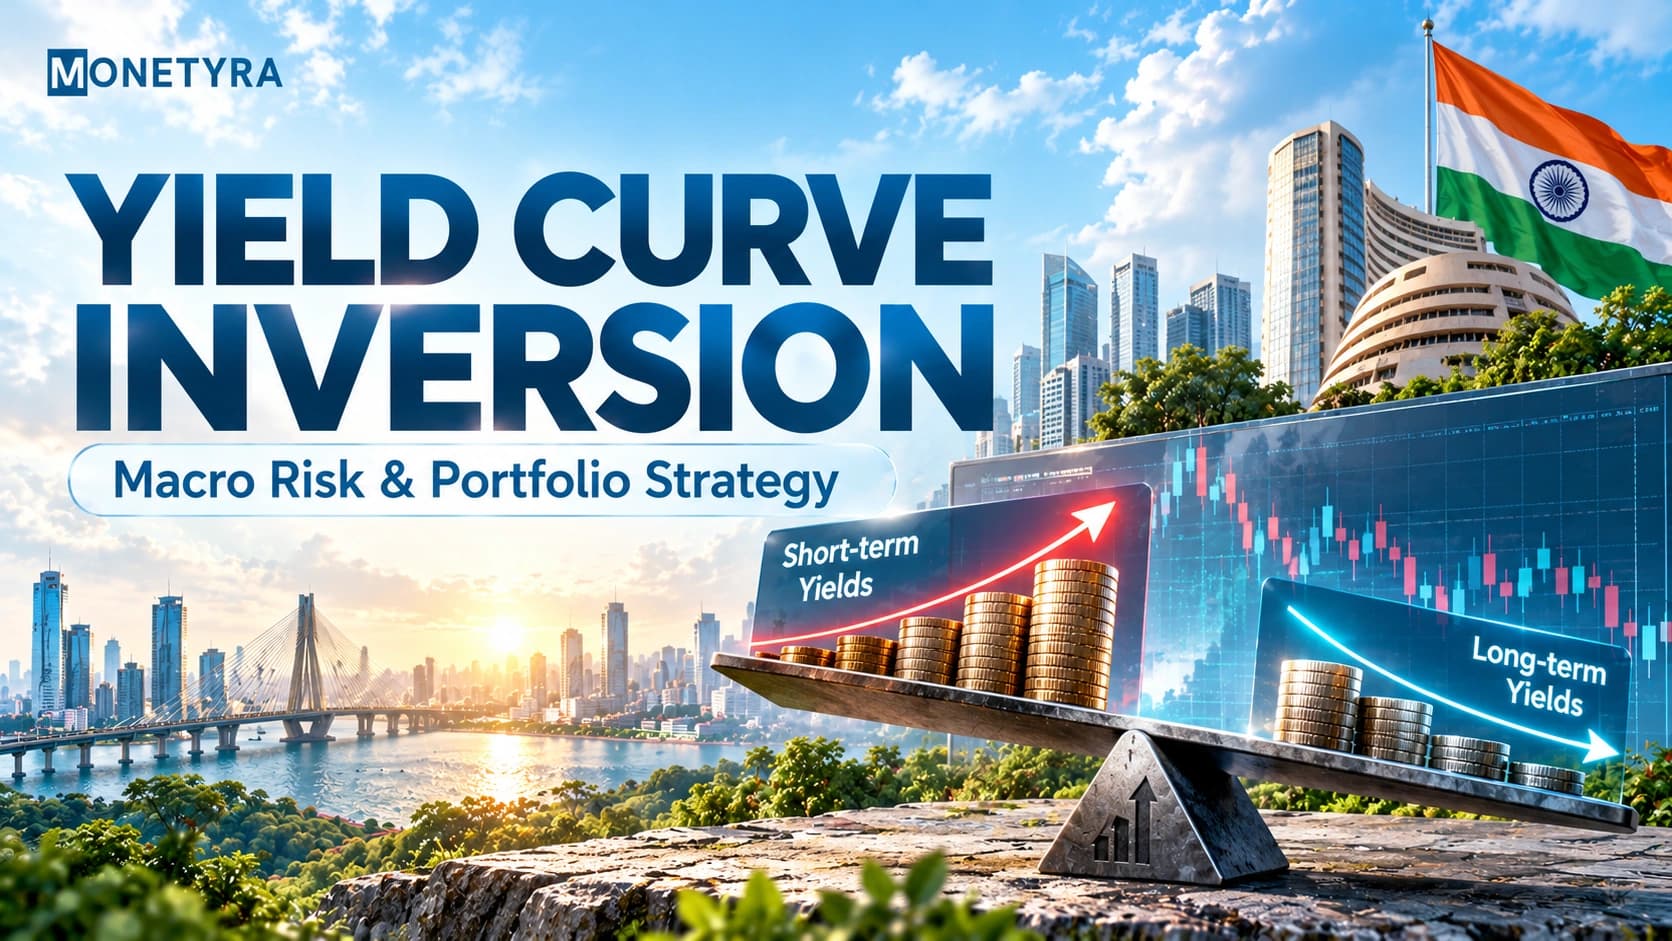
When short-term government bonds offer higher interest rates than long-term bonds, financial markets take notice. This unusual market distortion—known as a yield curve inversion—has historically served as a reliable leading indicator of economic slowdowns in major developed economies. However, interpreting what an inverted yield curve signals requires a nuanced understanding of institutional bond mechanics, central bank policy rate transmission, and how global yield differentials ripple across international capital flows into Indian debt and equity markets.
Quick Takeaways
- A yield curve inversion occurs when short-term sovereign bond yields exceed long-term yields, reflecting market expectations of future monetary easing and economic deceleration.
- While 10-year to 2-year US Treasury yield inversions have reliably preceded developed-market recessions, they represent a historical correlation rather than a guaranteed economic timeline.
- Indian Government Securities (G-Sec) markets rarely undergo full inversion due to structural retail demand and institutional holding mandates, exhibiting curve flattening during tight liquidity cycles instead.
What Is a Yield Curve Inversion?
It is a market condition where short-term debt instruments carry higher interest yields than long-term bonds of equivalent credit quality. Under normal economic conditions, fixed-income markets demand a “term premium”—an additional yield compensation for locking up capital over extended time horizons. Consequently, a standard yield curve slopes upward, with 10-year and 30-year sovereign bonds offering higher yields than 3-month or 2-year government paper.
An inverted yield curve emerges when aggressive central bank rate hikes push short-term yields upward while long-term bond yields remain suppressed or decline. Long-term yields are primarily driven by market expectations of future economic growth and inflation. When investors anticipate that elevated short-term interest rates will slow economic activity, they aggressively purchase long-term bonds to lock in multi-year yields. This surge in long-duration demand drives long-term bond prices higher and pushes their yields lower, ultimately flipping the traditional upward slope upside down.
Mechanics of the 10-Year to 2-Year Yield Spread
Here’s the number worth watching: the gap between 10-year and 2-year Treasury yields, often written as Y10-Y2. It’s simply the difference between what a 10-year government bond pays you and what a 2-year one pays.
10Y-2Y Yield Spread = Benchmark 10-Year Sovereign Yield − 2-Year Sovereign Yield
According to historical yield spread data compiled by the Federal Reserve Bank of St. Louis (FRED), the table below summarizes four major 10Y-2Y inversion cycles:
| Historical Inversion Cycle | Peak 10Y-2Y US Spread Inversion | Subsequent Economic Slowdown / Recession Window | S&P 500 Performance (Initial Inversion to Peak) |
|---|---|---|---|
| 2000 Cycle | -52 bps | 12 Months (2001 Tech Slowdown) | Flat to Negative |
| 2006 Cycle | -24 bps | 18 Months (2007–2008 Global Financial Crisis) | Initial Rally, Subsequent Drawdown |
| 2019 Cycle | -5 bps | 6 Months (2020 Exogenous Shock) | Initial Rally followed by Volatility |
| 2022–2024 Cycle | -108 bps | Extended Lag / Growth Moderation | Highly Sector-Divergent |
Is Yield Curve Inversion a Guaranteed Recession Predictor?
While financial commentary frequently cites this inversion as an infallible harbinger of recession, economic data indicates that an inversion is a signal of market expectations rather than a deterministic forecast. The metric reflects institutional sentiment regarding terminal policy rates and subsequent rate-cut cycles, but it does not guarantee a specific economic outcome.
Warning: Relying on yield curve inversions as a precise timing tool for market exits can lead to significant opportunity cost, as equities often rally in the intermediate months following an initial curve inversion.
Several structural factors influence the predictive reliability of the inversion in modern financial markets:
- Central Bank Balance Sheet Dynamics: Structural quantitative easing (QE) and quantitative tightening (QT) program interventions alter term premiums across long-duration bonds, distorting the natural price discovery mechanism of the yield curve.
- Variable Lag-Time Uncertainty: Historically, the time lag between an initial 10Y-2Y yield curve inversion and an official economic downturn ranges from 6 to 24 months, rendering it ineffective as a short-term market timing metric.
- False-Positive Variations: Structural shifts in global labor productivity, fiscal stimulus expansions, and corporate earnings resilience can allow economies to absorb elevated borrowing costs without entering a formal contractionary period.
US Treasury vs. Indian G-Sec Yield Curve Dynamics
A crucial distinction for domestic portfolio managers is the operational difference between the US Treasury market and the Indian Government Securities (G-Sec) market. True yield curve inversions are standard occurrences in US monetary cycles, but they are exceptionally rare in India’s sovereign debt market.
Indian banks are required by law to keep buying government bonds, so Indian yields rarely spike the way US yields do.
In the Indian debt market, sovereign bond yield behavior is anchored by specific institutional framework mechanisms:
- Statutory Liquidity Ratio (SLR) Mandates: Commercial banks in India are legally mandated to maintain a specific percentage of their Net Demand and Time Liabilities (NDTL) in sovereign G-Secs, maintaining a structural baseline demand for long-duration paper.
- Insurance and Pension Demand: Long-term domestic institutional investors, including Life Insurance Corporation (LIC) and provident funds, continually purchase 10-year to 40-year G-Secs to match long-term pension liabilities, capping long-end yield spikes.
- Yield Curve Flattening: Instead of full inversion, tight monetary policy by the Reserve Bank of India (RBI) typically leads to yield curve flattening, where the spread between short-term Treasury Bills (T-Bills) and 10-year G-Secs narrows significantly without consistently crossing into negative territory.
Impact of US Inversion on RBI Policy and Indian G-Secs
While domestic Indian G-Sec curves rarely invert, a prolonged yield curve inversion in the US financial system directly impacts Indian capital markets through foreign portfolio investor (FPI) allocation channels.
When short-term US Treasury yields rise significantly above long-term yields, global capital shifts toward high-yielding, short-term US paper. This alters foreign institutional investor flows across emerging markets:
- FPI Debt Outflows: Narrowing yield differentials between Indian G-Secs and US Treasuries can trigger foreign portfolio outflows from Indian debt, placing depreciation pressure on the Indian Rupee (INR).
- Imported Inflation and FX Defense: Exchange rate volatility forces the Reserve Bank of India (RBI) to adjust domestic systemic liquidity through fine-tuning operations or maintain higher policy rates for longer to protect the currency.
- Institutional Capital Tracking: Market participants monitor real-time institutional allocation swings through FII DII data to evaluate whether global yield shifts are causing foreign capital rotation out of domestic risk assets.
To track how the Reserve Bank of India evaluates global macroeconomic spillovers during policy adjustments, investors closely analyze the official RBI MPC outcome 2026 for policy rate guidance.
Asset Allocation Strategy: Navigating Inversion and Flattening
Navigating periods of yield curve inversion or structural flattening requires adjusting duration exposure in fixed income and rebalancing equity sector allocations. Rather than executing reactive sell-offs, institutional frameworks emphasize strategic diversification.
1. Fixed Income Duration Management
During late-stage tightening when yield curves flatten or invert, short-duration debt funds and money market instruments offer attractive risk-adjusted yields with low interest-rate volatility. As central banks reach peak policy rates, gradually extending portfolio duration into long-duration Debt Mutual Funds allows investors to lock in high yields and capture capital appreciation when rate-cut cycles eventually initiate.
2. Equity Sector Rotation
Late-cycle environments characterized by inverted yield curves historically favor defensive sectors with stable cash flows, low debt-to-equity ratios, and strong pricing power—such as Fast-Moving Consumer Goods (FMCG), Pharmaceuticals, and Information Technology (IT). High-leverage sectors and capital-intensive capital goods stock strategies typically experience valuation multiple compression until yield spreads normalize.
3. Hedging via Sovereign Assets
Allocating a portion of the portfolio to gold instruments—such as Gold ETFs or Sovereign Gold Bonds (SGBs)—provides an effective structural hedge against potential currency volatility and broader global market dislocations associated with late-cycle monetary adjustments.
Monetyra’s Take: A US yield curve inversion is a valuable macro signal, but Indian retail investors should avoid panic-selling domestic equities solely based on international bond headlines. India’s structural growth drivers and bank-led G-Sec demand mean yield curve flattening—rather than full inversion—is the primary domestic signal to monitor. Investors should focus on optimizing debt fund duration and maintaining defensive equity diversification rather than attempting short-term market timing.
Conclusion
A yield curve inversion remains one of the most monitored macroeconomic indicators in global finance, signaling shifting expectations around central bank monetary policy, inflation, and economic growth. While inversions in developed markets highlight late-cycle macroeconomic conditions, their direct translation to Indian markets manifests primarily through yield curve flattening and foreign portfolio reallocations. By understanding these underlying bond market mechanics, intermediate investors can systematically adjust asset allocations to maintain portfolio resilience across macroeconomic cycles.
Evaluate how global interest rate cycles and institutional capital flows impact your long-term investment strategy.
FAQs
It occurs when short-term government bond yields rise above long-term bond yields. It happens during aggressive central bank rate-hiking cycles when market participants anticipate future economic slowdowns and expect interest rates to decline over the long term, driving heavy buying into long-duration bonds.
No. While this market condition has a strong historical correlation with subsequent economic contractions in major developed economies, they represent market expectations rather than guaranteed predictions. Structural factors like central bank balance sheet policies and variable lag times mean an inversion does not guarantee an immediate or severe recession.
Stock market performance following an inversion is historically mixed. Equities often continue to rally in the months immediately following an initial inversion before experiencing heightened volatility as the economic slowdown materializes. Defensive sectors with low debt loads tend to outperform cyclical sectors during these phases.
Historically, when an economic contraction follows this market condition, it occurs with a significant time lag ranging anywhere from 6 to 24 months. Because of this wide time window, an inversion cannot be used as a precise short-term timing signal for exiting risk assets.
For Indian investors, an inversion in US Treasury curves signals potential global market volatility and foreign portfolio capital adjustments. In the domestic market, true inversions are rare; instead, investors should watch for Indian G-Sec yield curve flattening and adjust debt fund duration accordingly.
A US yield curve inversion driven by high US short-term rates can narrow the yield differential between US Treasuries and Indian G-Secs. This can lead to foreign portfolio outflows and currency pressure on the Rupee, prompting the Reserve Bank of India (RBI) to adjust systemic liquidity or maintain higher domestic repo rates to protect currency stability.
Disclaimer: This article was written with the help of AI and reviewed by Monetyra’s editorial team. It is for educational purposes only and should not be considered financial advice. Trading and investing in financial instruments involve significant risk of loss and are not suitable for all investors, and past performance of any strategy does not guarantee future results. Please consult a licensed financial advisor before making any investment or trading decision.
In India, the Reserve Bank of India (RBI) and Securities and Exchange Board of India (SEBI) regulate debt instruments, sovereign securities, and capital market participation. Readers are advised to verify the regulatory status of their intermediaries and ensure compliance with applicable Indian laws before investing.