Position Trading: How Long-Term Traders Ride Trends

Watching price ticks on a five-minute screen all day is exhausting, especially if you already have a full-time career. Many retail investors want to participate in major market moves without making dozens of rapid decisions every week. Position trading offers a slower, more deliberate alternative. By focusing on broad economic shifts and multi-week chart patterns, you let large trends unfold over time instead of reacting to daily noise.
Quick Takeaways
- Core Definition: This long-term approach involves holding market positions for weeks or months to capture major price trends rather than daily fluctuations.
- Analytical Focus: Traders combine fundamental data, such as corporate earnings and central bank policies, with weekly and daily price charts.
- Primary Trade-Off: Because holding trades across overnight sessions and weekends exposes capital to sudden price gaps and ongoing financing fees, you must use wider stop-losses and smaller trade sizes.
What Is Position Trading?
Position trading is a long-term trading style where you hold an asset for weeks or months to capture major structural price trends.
In India, brokers and market participants commonly refer to this style as positional trading. Unlike intraday participants who must square off their trades before the 3:30 PM IST market close on the National Stock Exchange (NSE) or Bombay Stock Exchange (BSE), positional traders intentionally hold trades overnight and across weekends.
There is no fixed calendar timer for exiting a trade. Most positions stay open for several weeks to a few months, depending on how long the underlying trend remains intact. You typically exit only when a major technical support level breaks, a central bank shifts its interest rate policy, or a company’s financial outlook deteriorates.
Position Trading vs. Swing and Intraday Trading
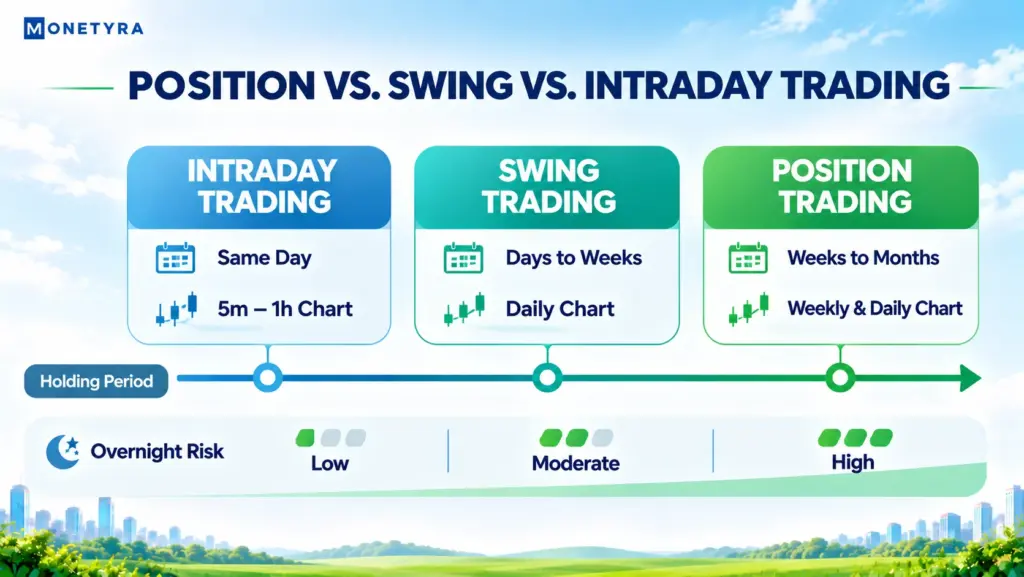
While all three trading styles aim to profit from price movement, they differ sharply in holding duration, chart timeframes, and overnight exposure.
| Feature | Intraday Trading | Swing Trading | Position Trading |
|---|---|---|---|
| Holding Period | Minutes to hours (closed same day) | Several days to a few weeks | Several weeks to many months |
| Primary Charts | 5-minute to 1-hour charts | 4-hour and daily charts | Weekly and daily charts |
| Analysis Style | Short-term price action and volume | Technical patterns and momentum | Macro fundamentals plus trend indicators |
| Overnight Risk | None | Moderate overnight gap exposure | High exposure to earnings and policy gaps |
If you are deciding between shorter timeframes, read our breakdown of swing trading and day trading differences to see how faster setups operate. For Indian equity traders comparing cash holdings against same-day trades, reviewing delivery vs. intraday trading rules and charges clarifies how holding duration affects your brokerage and tax costs.
Core Tools Used in Position Trading
To filter out short-term market noise, positional traders rely on three core analytical tools rather than fast intraday indicators.
- Weekly and Daily Charts: Higher timeframes compress five days of price action into a single weekly candle. This wider view helps you spot multi-month support, resistance, and breakout levels without getting shaken out by minor daily dips.
- Long-Term Moving Averages: Indicators such as the 50-day and 200-day simple moving averages (SMA) help confirm the primary direction of a market. When price stays consistently above a rising 200-day SMA, traders generally view the broader trend as upward.
- Fundamental and Macro Data: Because trends lasting several months are driven by real economic value, traders track earnings growth, inflation reports, and monetary policy decisions from the Reserve Bank of India (RBI) or global central banks.
How Position Trading Works: A Hypothetical Indian Market Example
Consider a hypothetical example on the Nifty 50 index to see how a positional setup comes together without chasing daily headlines.
- Macro Alignment: Suppose domestic inflation cools and corporate earnings across major sectors show steady quarterly growth, creating a supportive backdrop for Indian equities.
- Weekly Chart Confirmation: On the weekly chart, the Nifty 50 breaks above a four-month resistance zone and holds above its 200-day moving average.
- Trade Execution and Stop-Loss: In this hypothetical scenario, a trader enters a long index position at an illustrative level of 24,000 and places a wide stop-loss below the prior weekly swing low at 23,100 (a 900-point risk buffer).
- Holding Through Pullbacks: Over the next three months, the index dips 300 points during a routine market pullback, which stays well above the 23,100 stop-loss. The trader holds the position until the weekly trend structure eventually weakens.
Overnight Risks, Holding Costs, and Risk Control
Holding trades across weeks or months introduces specific risks and carrying costs that do not affect intraday traders.
- Overnight and Weekend Gap Risk: Markets can open sharply higher or lower after quarterly earnings announcements, global geopolitical news, or RBI policy updates. A sudden price gap can jump right past your stop-loss order, causing a larger loss than planned.
- Equity Holding and MTF Costs: Buying shares in the cash delivery segment avoids ongoing interest charges. However, if you use a Margin Trading Facility (MTF) regulated under Securities and Exchange Board of India (SEBI) guidelines to borrow funds for holding eligible Group 1 stocks, your broker charges daily interest—typically ranging from 10% to 18% per annum—on the funded amount for as long as the position stays open.
- F&O Rollover Costs: If you trade futures or options on the National Stock Exchange (NSE), contracts expire on fixed monthly dates—typically the last Tuesday of each month (or the preceding trading day if Tuesday is a market holiday). To hold a positional view beyond one month, you must close the expiring contract and open a new one for the next month—a process called a rollover, which incurs additional brokerage, statutory taxes, and bid-ask spread costs.
Because wider stop-losses are required to survive normal market swings, you must reduce your trade size so that a single loss never damages your overall account. Learning proper position sizing in trading ensures your capital stays protected even during multi-week drawdowns.
Monetyra’s Take
Position trading removes the pressure of watching intraday charts, making it practical if you balance trading alongside a full-time job. However, holding positions across weeks or months requires patience during routine market pullbacks and strict attention to overnight gap risk and MTF or rollover financing charges. Success with this style depends less on predicting short-term price swings and more on sizing your trades small enough to withstand wide stop-losses.
Conclusion
This long-term trading approach suits patient market participants who prefer studying broad economic trends over watching minute-by-minute price screens. By combining weekly charts, moving averages, and fundamental research, you can participate in major market moves with far fewer transactions. Always balance that patience with strict awareness of overnight gap risks, financing costs, and disciplined risk limits.
Build Your Market Foundation
Explore step-by-step trading lessons designed for beginners in our academy.
FAQs
1. What is position trading, and is it the same as positional trading?
Position trading—widely called positional trading in India—is a long-term strategy where you hold a stock, currency, or index position for weeks or months to capture major trends. Both terms describe the exact same approach of ignoring daily price noise to focus on broader market direction.
2. How does position trading differ from swing trading?
Swing trading targets shorter price waves lasting a few days to a couple of weeks, relying mostly on daily technical charts. Position trading holds through multiple minor swings for weeks or months, combining weekly charts with macroeconomic and fundamental analysis.
3. What is the difference between intraday and positional trading?
Intraday trading requires opening and closing all positions on the same trading day before the 3:30 PM IST market close, avoiding overnight exposure. Positional trading carries trades overnight and across weekends for weeks or months, which introduces overnight gap risk and potential financing or rollover charges.
4. Which indicators work best for position trading?
Long-term moving averages, particularly the 50-day and 200-day simple moving averages (SMA), are widely used to identify primary market direction and filter out daily volatility. Many traders pair these indicators with weekly support and resistance levels rather than fast intraday oscillators.
5. What are the main costs of holding a positional trade in India?
If you purchase equities with full cash in the delivery segment, you pay no daily interest. However, holding leveraged stock positions through a Margin Trading Facility (MTF) incurs daily broker interest, while holding F&O positions across months requires paying brokerage, taxes, and spread costs during contract rollovers.
Disclaimer: This article was written with the help of AI and edited by the Monetyra editorial team. It is for educational purposes only and should not be considered financial advice. Trading and investing in financial instruments involve significant risk of loss and are not suitable for all investors. Please consult a licensed financial advisor before making any investment or trading decision.