ADX Indicator Explained: How to Read Trend Strength
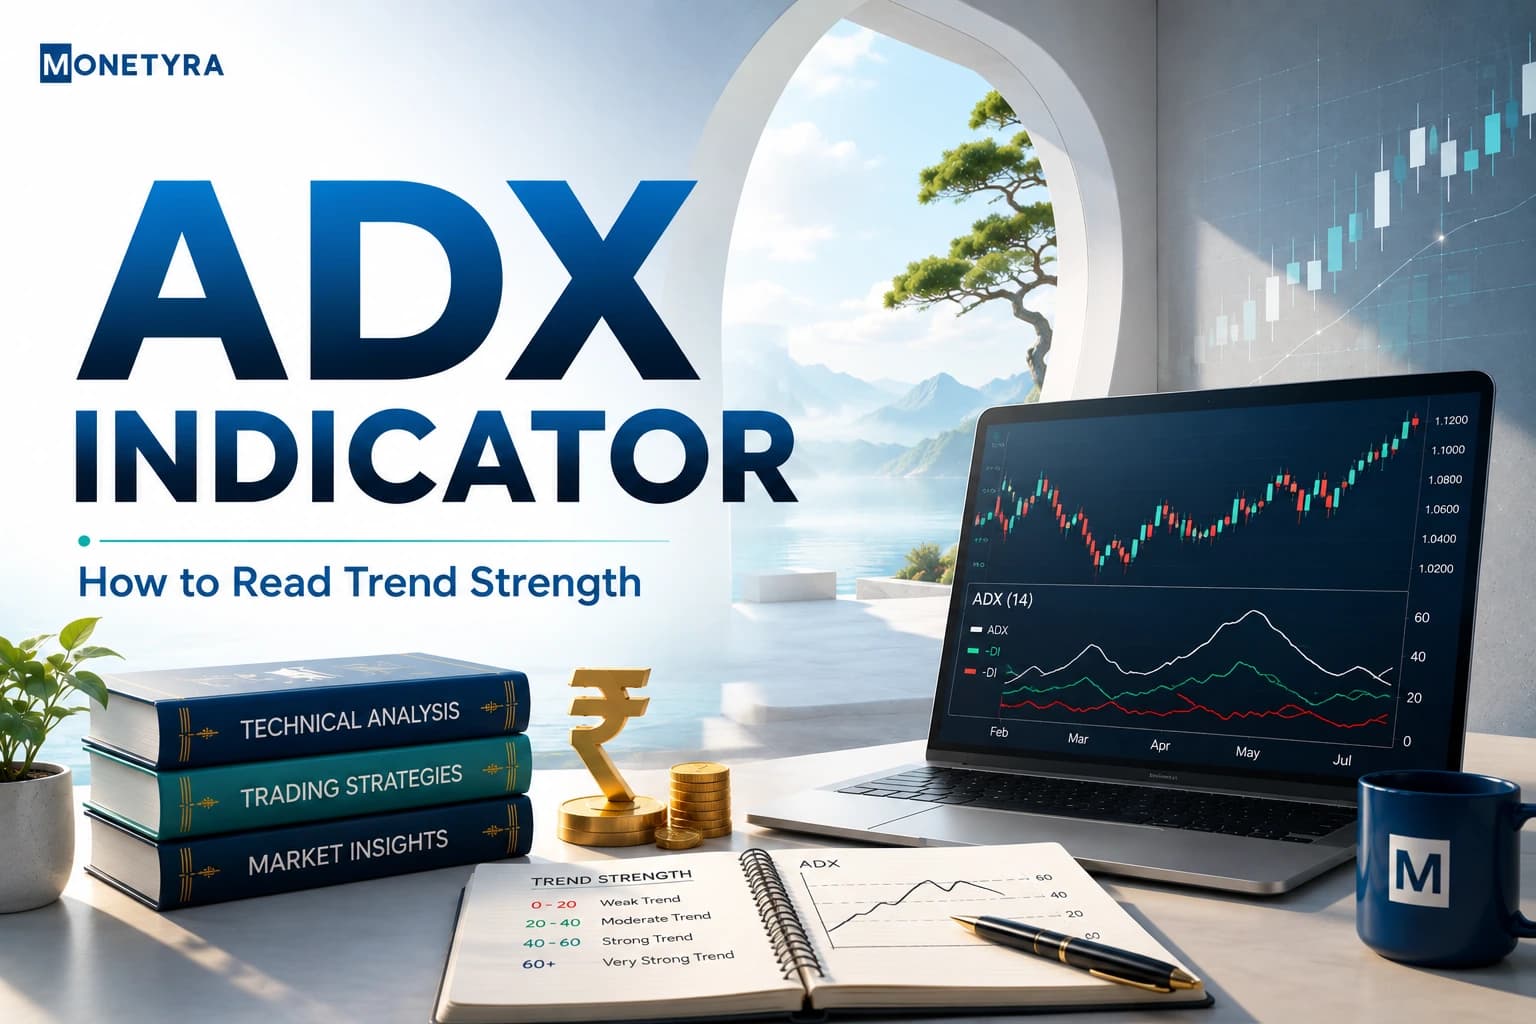
Entering a trade right as a breakout occurs only to watch price stall into sideways consolidation is one of the most frustrating experiences in technical trading. Most retail traders focus entirely on predicting direction, ignoring whether the market actually possesses enough underlying momentum to sustain a move. The ADX indicator solves this specific structural problem by measuring pure trend strength on a normalized scale regardless of whether price moves up or down.
Quick Takeaways
- The ADX indicator is a non-directional technical oscillator developed by J. Welles Wilder that measures momentum strength on a 0 to 100 scale.
- An ADX reading above 25 confirms a strong trend suitable for momentum strategies, while readings below 20 signal a weak, range-bound market.
- Because the ADX relies on smoothed moving averages, it is inherently lagging and must be paired with price action or stop-loss discipline to manage risk.
What Is the ADX Indicator?
The ADX indicator—the Average Directional Index—is a non-directional technical analysis tool designed to quantify the expansion or contraction of price movement strength. Created by J. Welles Wilder in 1978, the ADX operates on a scale ranging from 0 to 100.
Unlike conventional momentum oscillators that signal overbought or oversold conditions, the ADX line does not tell you whether price is bullish or bearish. Instead, it measures how powerfully price is moving away from a previous balance point. A rising ADX line during a steep market decline signals powerful selling momentum, while a rising ADX line during an aggressive rally signals strong buying momentum. Understanding what is ADX indicator mechanics are allows traders to filter out low-probability trades during choppy, sideways markets where breakout strategies frequently fail.
How the Indicator Works: Key Components (+DI and -DI)
To read the ADX correctly on a trading platform, you must understand its three underlying directional lines:
- Plus Directional Indicator (+DI): Measures upward price pressure over a defined lookback period by comparing current highs to previous highs.
- Minus Directional Indicator (-DI): Measures downward price pressure over the same period by comparing current lows to previous lows.
- Average Directional Index (ADX): Calculates the smoothed difference between +DI and -DI to produce a single non-directional trend strength curve.
The ADX line is a smoothed moving average of the Directional Movement Index (DMI). Because these formulas rely on historical price data over standard lookback windows, the ADX is fundamentally a lagging indicator. It confirms existing trend momentum rather than predicting future market pivots.
Tip: Treat +DI and -DI as directional steers and the main ADX line as the speed accelerator.
How to Read ADX Indicator Values
Interpreting the numerical value of the ADX line allows traders to match their technical entry tactics with current market structure:
- Sub-20 Threshold (Weak / Accumulation Phase): Indicates a choppy, non-trending market environment. Trend-following and breakout strategies perform poorly here due to frequent whipsaws.
- 20–25 Transition Zone: Signals that market momentum is beginning to build or weaken. Many quantitative setups consider 20 as the early filter line for potential trade preparation.
- Above 25 Threshold (Strong Trend): Confirms sustained trend momentum. This is the optimal environment for entering breakouts, pullbacks, and trend-continuation setups.
- Above 40 Extreme (Overextended Trend): Highlights exceptionally strong momentum, but values reaching 40 to 50 often precede market exhaustion, tight consolidation, or sudden sharp pullbacks.
| ADX Value Range | Trend Strength Description | Recommended Trading Approach |
|---|---|---|
| 0 – 20 | Absent or Weak Trend | Mean-reversion, range trading, or staying aside |
| 20 – 25 | Emerging Momentum | Watchlist building and breakout preparation |
| 25 – 40 | Strong Trend | Trend-following setups, pullbacks, and breakouts |
| 40 – 50+ | Extreme / Overextended Trend | Trailing stop tightening and partial profit booking |
ADX Indicator Strategy: Step-by-Step Trading Guide
Combining directional crossovers with trend strength filtering forms the core framework of an actionable ADX indicator strategy:
- Step 1 — Confirm Underlying Trend Strength: Check that the main ADX line is above 25 and sloping upward, confirming sufficient market expansion.
- Step 2 — Identify Directional Dominance: Observe the orientation of the directional lines. If +DI is above -DI, the directional bias is bullish. If -DI is above +DI, the directional bias is bearish.
- Step 3 — Wait for Price Action Confirmation: Execute trades only when price breaks through key structural levels, such as a recent swing high, horizontal resistance, or VWAP trading strategy intraday baselines.
- Step 4 — Position Risk Management: Place an initial stop-loss order below the entry candle swing low (for long trades) or above the swing high (for short trades).
| Strategy Setup | Directional Alignment | Mandatory ADX Threshold | Stop-Loss Location | Profit Target |
|---|---|---|---|---|
| Bullish Breakout | +DI crosses above -DI | ADX > 25 and rising | Below breakout structure / VWAP | Recent swing high / 1:2 Risk-Reward |
| Bearish Breakdown | -DI crosses above +DI | ADX > 25 and rising | Above breakdown structure / VWAP | Recent swing low / 1:2 Risk-Reward |
Warning: Never trade a +DI or -DI crossover in isolation when the ADX line remains stuck below 20, as non-trending markets produce constant false crossover signals.
Recommended ADX Indicator Settings for Intraday
The standard default setting for the ADX indicator across trading platforms is 14 periods. On daily and 4-hour charts, 14 periods balances responsiveness with noise reduction.
For ADX indicator settings for intraday execution on 5-minute or 15-minute timeframes, active traders often adjust parameters based on market volatility:
- Default 14-Period Setting: Offers reliable signals with fewer false whipsaws, though entries may occur slightly later during fast intraday moves.
- Smoothed 7–10 Period Setting: Increases sensitivity for short-term scalping setups, providing faster crossover notifications at the cost of higher noise in tight consolidation ranges.
Common ADX Indicator Trading Mistakes
- Confusing Trend Strength with Market Direction: Buying an asset simply because the ADX line is rising rapidly during an aggressive market crash. A rising ADX indicates powerful movement—if -DI is on top, that power belongs entirely to sellers.
- Chasing Crossovers in Low Volatility: Taking directional trades every time +DI and -DI cross while ADX sits below 20. In range-bound markets, directional lines crisscross frequently without delivering sustained follow-through.
- Ignoring Price Structure and Key Levels: Relying blindly on indicator thresholds without analyzing support, resistance, or market structure. Indicators confirm momentum; market structure dictates execution context.
ADX Indicator in Indian Markets (Nifty & BankNifty Intraday)
Applying technical tools on the National Stock Exchange (NSE) requires accounting for local session characteristics. During standard trading hours (9:15 AM to 3:30 PM IST), Nifty 50 and Bank Nifty index futures exhibit distinct intraday structural phases.
During the opening 9:15 AM to 9:45 AM volatility window, overnight gaps can cause temporary ADX spikes that reverse sharply once institutional order flow settles. Intraday traders on the NSE frequently use the ADX as a filter. If Nifty 50 trades on a 5-minute timeframe with an ADX below 20 between 10:30 AM and 1:30 PM IST, trend-following options buying strategies often face rapid time decay.
Furthermore, Indian retail intraday equity and derivatives positions face mandatory broker auto square-off rules (typically around 3:15 PM IST). When holding trend positions confirmed by a high ADX late in the session, traders must factor in mandatory closing times rather than expecting extended multi-hour holding periods.
In India, the Securities and Exchange Board of India (SEBI) regulates equity and derivatives market frameworks. Traders must manage position leverage responsibly and maintain capital preservation controls under applicable margin rules.
Conclusion
The ADX indicator is one of the most widely used non-directional filters in technical analysis. By decoupling movement strength from price direction, it allows traders to separate trending, high-probability market regimes from choppy ranges where capital gets eroded by false breakouts.
Master trend strength filters for cleaner market entries.
Disclaimer: This article was written with the help of AI and reviewed by the Monetyra editorial team. It is for educational purposes only and should not be considered financial advice. Trading and investing in financial instruments involve significant risk of loss and are not suitable for all investors, and past performance of any strategy does not guarantee future results. Please consult a licensed financial advisor before making any investment or trading decision.
In India, SEBI oversees stock exchange and derivatives operations. Readers are advised to verify the regulatory status of their intermediary and ensure compliance with applicable Indian laws before trading.
FAQs
The indicator is used primarily to measure market trend strength on a 0 to 100 scale, helping traders identify whether a market is strongly trending or moving sideways in a range.
The standard and most versatile setting for the ADX indicator is 14 periods. For shorter timeframe intraday charts like 5-minute graphs, some traders lower the parameter to 7–10 periods for faster sensitivity.
An ADX reading above 25 indicates that the current market possesses strong trend momentum, confirming a suitable environment for trend-following and breakout trading setups.
The ADX is a lagging indicator because its calculation is based on historical moving averages of directional price movement. It confirms existing momentum rather than forecasting market turnarounds.
To trade crossovers, wait for the ADX line to rise above 25. Enter a long position when +DI crosses above -DI, or enter a short position when -DI crosses above +DI, placing stop-losses beyond recent swing levels.
The ADX measures non-directional trend strength regardless of price direction, whereas the Relative Strength Index (RSI) measures directional momentum and overbought or oversold conditions relative to price levels.