Doji Candlestick Pattern
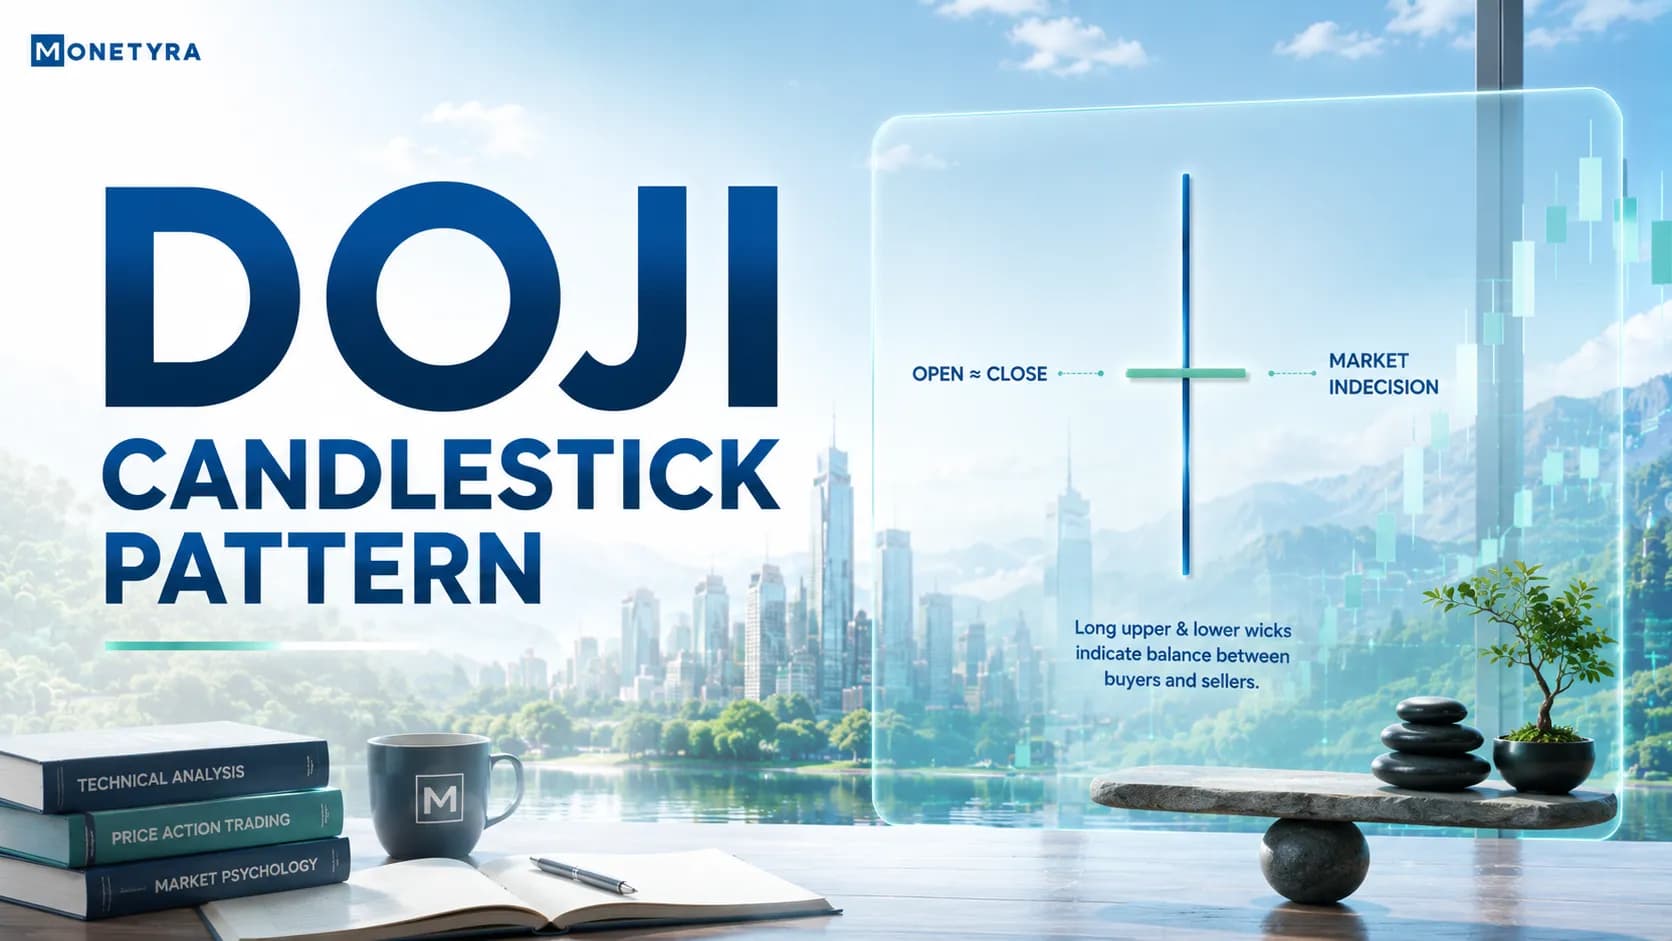
A doji candlestick pattern is a single-bar technical chart formation where the open and close prices are virtually identical, producing a paper-thin real body with wicks of varying lengths. It shows that buyers and sellers fought aggressively during the session, but neither side established directional control by the close, signaling a pause in momentum and potential market reversal.
If you have ever watched a strong stock rally suddenly grind to a halt, you have witnessed the supply and demand equilibrium that creates a doji. Derived from the Japanese word meaning “same time” or “blunder,” the formation visually resembles a cross or plus sign. However, trading a doji successfully requires more than simply buying or selling whenever a cross appears on your chart.
Because the pattern represents market indecision rather than an immediate breakout signal, traders must analyze surrounding support and resistance, volume context, and next-candle confirmation. This guide breaks down the primary doji types, explains how to distinguish dojis from similar candles, provides a step-by-step trading framework, and highlights key risk controls.
Quick Takeaways
- Supply-Demand Balance: A doji forms when open and close prices match, creating a paper-thin real body that reflects equal power between bulls and bears.
- Visual Alert of Indecision: The pattern warns that the prevailing trend is losing steam, making it a critical watch item for trend exhaustion.
- Five Structural Variants: Dojis manifest in five key forms—Standard, Long-Legged, Dragonfly, Gravestone, and 4-Price—each carrying unique price action implications.
- Mandatory Follow-Through Confirmation: Never execute a trade based solely on a doji; always wait for the next candle to close beyond the doji’s extreme high or low.
- Defined Risk Placement: The upper and lower wick extremes of the doji candle supply natural technical levels for protective stop-loss orders.
Disclaimer: This article is for educational purposes only and does not constitute financial advice. Trading in financial instruments involves significant risk of loss and is not suitable for all investors. Past performance of any trading strategy does not guarantee future results.
What Is a Doji Candlestick Pattern?
A doji candlestick pattern is a single-bar technical chart formation where the open and close prices are virtually identical, producing a paper-thin real body with wicks of varying lengths.
To understand the market mechanics behind a doji, imagine an intense tug-of-war match between two evenly matched teams. Both sides pull with maximum effort throughout the session, driving prices to intraday highs and lows. However, by the time the closing bell rings, the market returns exactly to where the session started. When a doji forms after an extended uptrend or downtrend, it signals that the dominant group (buyers or sellers) has run out of momentum.
Tips: Many experienced price action traders monitor session volume when a doji forms. A high-volume doji following a prolonged trend indicates heavy institutional selling meeting aggressive buying, dramatically increasing the probability of a multi-day trend reversal.
Anatomy of a valid doji pattern:
- Real Body: Virtually non-existent (appears as a thin horizontal line where Open ≈ Close).
- Upper Shadow (Wick): Represents the highest price reached by buyers during the session.
- Lower Shadow (Tail): Represents the lowest price reached by sellers during the session.
- Location Context: A doji appearing in a flat, sideways market reflects normal market noise, whereas a doji forming at key technical support or resistance acts as a strong reversal warning.
The 5 Main Types of Doji Candlesticks
Dojis take on different technical meanings based on the length and placement of their wicks relative to the real body. Understanding the types of doji candlestick helps traders gauge directional bias.

1. Standard (Neutral) Doji
Featuring small upper and lower wicks of roughly equal length, the standard doji forms a classic plus sign. It indicates pure market neutrality, where neither buyers nor sellers gained an advantage.
2. Long-Legged Doji
A long-legged doji has unusually long upper and lower shadows. This shape reflects extreme intraday volatility and aggressive struggle, but the market still settled back at the opening price.
3. Dragonfly Doji (Bullish-Leaning)
The dragonfly doji has a long lower shadow and virtually no upper shadow, with the open, high, and close all near the top of the bar. Sellers drove prices down sharply, but aggressive buyers pushed the price back to the open before the close.
4. Gravestone Doji (Bearish-Leaning)
The gravestone doji candlestick pattern features a long upper shadow and no lower shadow, with the open, low, and close near the bottom of the bar. Buyers rallied strongly, but sellers completely overwhelmed them, pushing the close back down to the open. Understanding the doji candle meaning at this level helps traders gauge directional bias before entering a trade, since a doji is a classic indecision candlestick showing that buyers and sellers reached a temporary standstill during the session.
5. 4-Price Doji
A simple horizontal line with no upper or lower wicks (Open = High = Low = Close). This ultra-rare bar appears almost exclusively in extremely illiquid stocks or during halted trading sessions.
| Doji Variant | Physical Structure | Intraday Price Action | Sentiment Bias |
|---|---|---|---|
| Standard Doji | Short upper and lower wicks | Balanced back-and-forth trading | Pure Neutral |
| Long-Legged Doji | Long upper and lower wicks | High intraday expansion & recovery | Neutral / Volatile |
| Dragonfly Doji | Long lower wick, no upper wick | Downward move rejected completely | Bullish-leaning |
| Gravestone Doji | Long upper wick, no lower wick | Upward rally rejected completely | Bearish-leaning |
| 4-Price Doji | Single line, zero wicks | No price variance across session | Illiquid / Inactive |
Doji vs Spinning Top: Key Differences Explained
Traders frequently confuse dojis with spinning top candles because both signal market indecision. However, their real body structures establish clear differences.
When evaluating doji vs spinning top setups, examine the thickness of the candle body:
- Doji Pattern: The open and close prices are virtually identical, resulting in a thin horizontal line for a body. It reflects absolute balance where neither side gained any net progress.
- Spinning Top Pattern: The candle contains a small, distinct real body (green or red) where the open and close differ slightly. While it still shows indecision, one side maintained a minor price edge.
| Feature / Parameter | Doji Candlestick Pattern | Spinning Top Pattern |
|---|---|---|
| Real Body Appearance | Paper-thin line (Open ≈ Close) | Small, visible rectangular body |
| Price Difference (Open vs Close) | Negligible to zero | Small, but clearly defined |
| Equilibrium Intensity | Complete buyer-seller balance | Moderate indecision |
| Body Color Significance | Color is irrelevant (no real body) | Green or red body adds minor bias |
How to Trade Doji Candlesticks (Step-by-Step)
Trading doji patterns effectively requires combining location analysis, confirmation candles, and strict risk control parameters.
Step 1: Confirm Technical Location
Never trade a doji simply because it appears on a chart. Ensure the doji aligns with a major market level:
- Historical horizontal support or resistance lines.
- Key moving averages (e.g., 50-day or 200-day EMA).
- Anchor points like Fibonacci retracement levels.
Step 2: Wait for Next-Candle Confirmation
Do not enter a trade on the close of the doji candle. Wait for the following candle to confirm directional momentum:
- Bullish Reversal: Enter when the subsequent candle closes above the high of the doji bar.
- Bearish Reversal: Enter when the subsequent candle closes below the low of the doji bar.
Step 3: Set Protective Stop-Loss (SL)
Place your stop-loss order slightly beyond the extreme wick of the doji candle:
- For long trades, place the SL just below the lowest wick tip of the doji.
- For short trades, place the SL just above the highest wick tip of the doji.
Step 4: Establish Take-Profit (TP) Targets
Target the next logical market boundary, such as a prior swing high or major support zone, seeking a minimum 1:2 Risk-to-Reward ratio.
Step-by-Step Indian Rupee (₹) Trade Execution Example
Consider a trade setup on an Indian equity stock rebounding off support:
- Prior Price Action: An NSE equity stock declines steadily from ₹1,450 to ₹1,380.
- Doji Formation: At horizontal support near ₹1,380, a Dragonfly Doji forms:
- Open = ₹1,382, High = ₹1,384, Low = ₹1,360, Close = ₹1,382.
- Confirmation Candle: The next 15-minute candle opens at ₹1,382 and closes green at ₹1,402 (above the doji high of ₹1,384).
- Trade Entry: Long position executed at ₹1,404 on the open of the third candle.
- Stop-Loss Placement: Set at ₹1,356 (₹4 below the doji’s lowest wick of ₹1,360).
- Risk per share = ₹1,404 − ₹1,356 = ₹48.
- Take-Profit Target: Aiming for a 1:2 Risk-to-Reward ratio:
- Target Profit per share = ₹48 × 2 = ₹96.
- Take-Profit Price = ₹1,404 + ₹96 = ₹1,500 (positioned near prior swing resistance at ₹1,495–₹1,505).
When It Works Best vs Conditions to Avoid
Filtering out poor market conditions significantly improves doji trade reliability:
High-Probability Conditions (When It Works Best)
- Key Level Confluence: The doji forms directly at major historical support/resistance or a trendline touchpoint.
- Technical Divergence: Indicators display weakening trend momentum, such as RSI divergence, where price reaches a new extreme but RSI fails to confirm.
- High Volume Exhaustion: A surge in volume on the doji candle highlights aggressive institutional activity battling to halt the current move.
High-Risk Conditions (Conditions to Avoid)
- Flat Sideways Range: Doji candles occurring in low-volume, sideways channels represent market noise rather than trend exhaustion.
- Pre-News Releases: Avoid trading doji patterns right before major Reserve Bank of India (RBI) rate decisions or central bank speeches, as sudden news spikes can cause heavy slippage.
- Unconfirmed Entries: Entering a trade immediately on the doji close without waiting for follow-through leaves you vulnerable to trend continuation.
Common Mistakes When Trading Doji Patterns
Traders often encounter unexpected losses when trading doji setups due to key execution errors:
1. Assuming Every Doji Signals a Reversal
A doji represents market pause and indecision—not an automatic reversal. In strong trends, a doji often acts as a brief consolidation before the original trend resumes.
2. Ignoring Wider Market Structure
Spotting a doji in isolation without considering surrounding price action is a major risk. A doji in the middle of a trading range lacks technical significance.
3. Setting Tight Stop-Losses Above the Body
Placing stop-losses near the thin doji real body rather than beyond its extreme wick leads to early stop-outs caused by normal market noise.
Review your risk management plan for traders to determine correct position limits before trading indecision bars.
Doji Candlestick Patterns in Indian Markets (NSE/BSE)
Applying doji strategies across Indian cash equities and derivative markets involves adjusting for session flow and opening gaps:
Session Dynamics on NSE and BSE
Traders on the National Stock Exchange (NSE) and Bombay Stock Exchange (BSE) track intraday timeframes (such as 5-minute or 15-minute charts) during standard session hours from 09:15 AM to 03:30 PM Indian Standard Time (IST).
- Morning Opening Volatility (09:15 – 09:45 AM IST): Gaps at the opening bell often generate long-legged doji candles as the market absorbs overnight global news. Wait for the initial 30-minute volatility to settle before executing entries.
- Mid-Day Consolidation (11:30 AM – 01:30 PM IST): Volume typically decreases during mid-day trading, producing frequent standard dojis across Nifty 50 and Bank Nifty contracts. Treat mid-day dojis with caution unless they align with key daily support or resistance levels.
Incorporate these market session nuances into your overall intraday trading strategy to select high-probability trade setups.
Conclusion
The doji candlestick pattern is an essential technical indicator for identifying market indecision and potential momentum exhaustion. By recognizing when buyers and sellers reach temporary equilibrium, traders gain advance warning that a prevailing trend may be stalling.
However, a doji bar should never be traded on its own. Always pair doji setups with strong technical location, volume confirmation, and next-candle follow-through before placing trades. To expand your technical analysis skills and price action strategies, explore our resources in our stock academy.
FAQs
A doji candlestick pattern is a single-bar pattern where open and close prices sit nearly identical. It forms a thin horizontal body with upper and lower wicks, showing balance and indecision between buyers and sellers.
A doji is directionally neutral by default. The Dragonfly Doji carries a bullish bias, while the Gravestone Doji carries a bearish bias. Its location relative to the existing trend determines its actual direction.
The five primary types are the Standard Doji, Long-Legged Doji, Dragonfly Doji, Gravestone Doji, and 4-Price Doji.
A doji has a paper-thin real body because open and close prices match. A spinning top has a small, distinct rectangular body that shows a slight difference between open and close.
Find a doji forming at key support or resistance. Wait for the next candle to close beyond the doji’s extreme wick, enter the trade, set a stop-loss past the opposite wick tip, and target a 1:2 risk-to-reward ratio.
No. A doji signals a momentum pause and indecision, which can lead to either a reversal or a brief consolidation before the original trend continues.
Disclaimer: This article was drafted with the assistance of AI and reviewed for accuracy by the Monetyra editorial team. It is for educational purposes only and should not be considered financial advice. Trading in financial instruments involves significant risk of loss and is not suitable for all investors, and past performance of any trading strategy does not guarantee future results. Please consult with a licensed financial advisor before making any trading decisions.
In India, equity and derivative trading is regulated by the Securities and Exchange Board of India (SEBI). Investors are advised to trade only through licensed brokers and adhere to all regulatory guidelines issued by SEBI and domestic exchanges.