Harami Candlestick Pattern
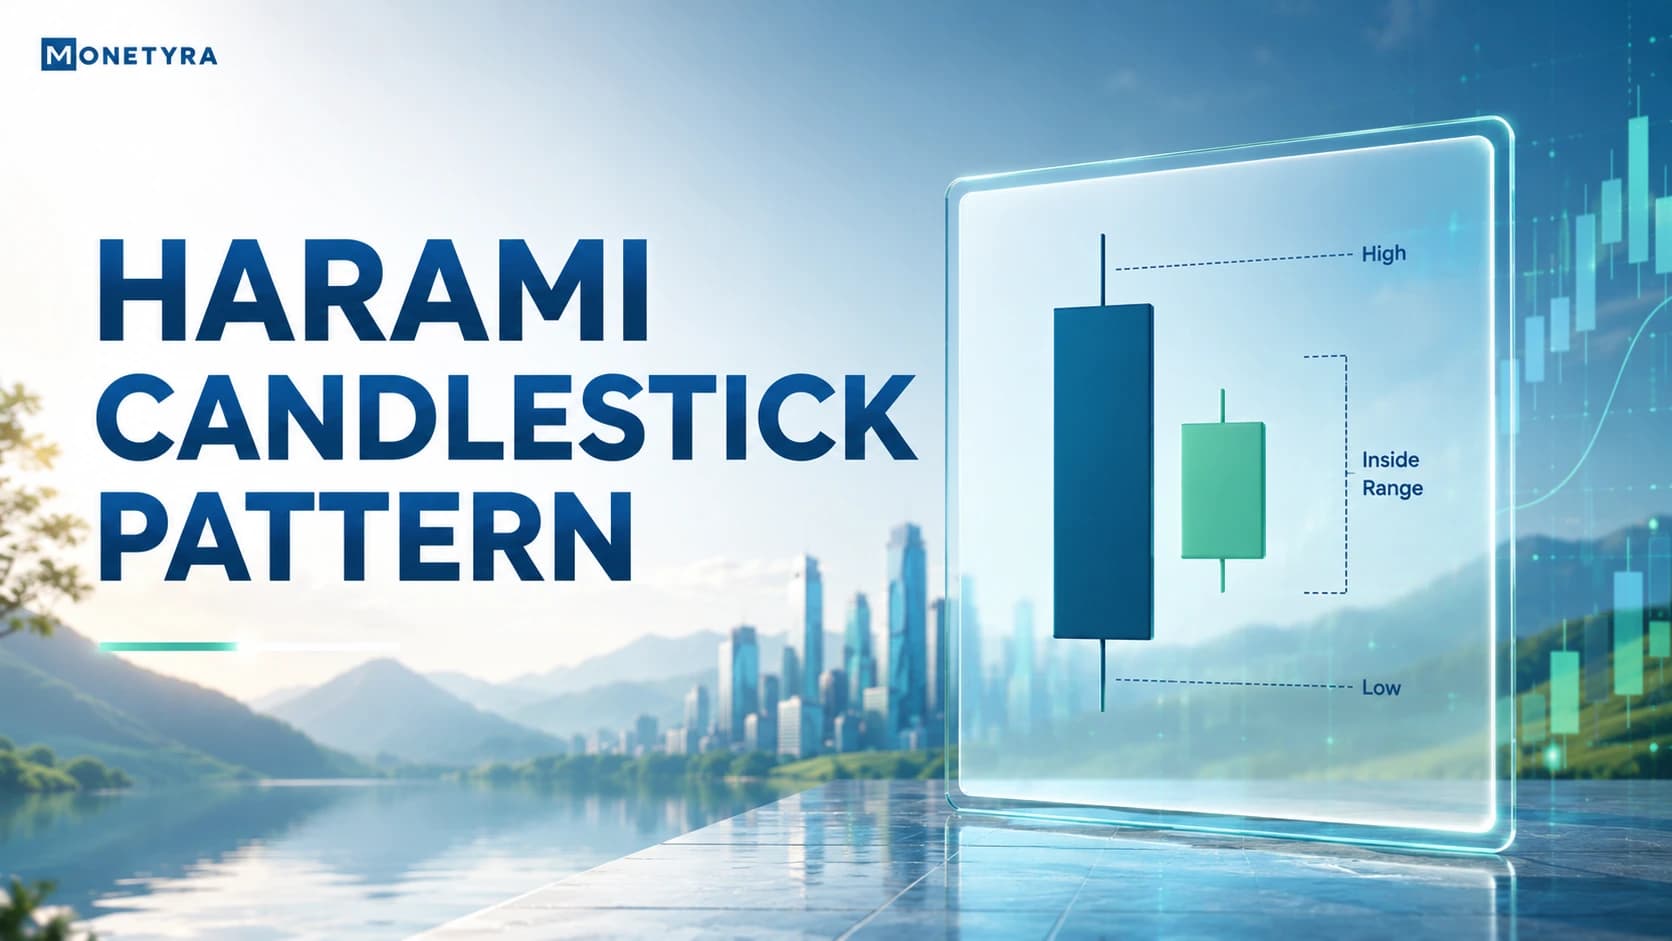
A harami candlestick pattern is a two-bar technical chart formation where a small second candle’s real body is completely enclosed within the larger real body of the preceding candle. It indicates that the prevailing market trend has lost momentum and entered a period of tight consolidation, signaling a potential price reversal or trend pause.
If you have ever watched a strong stock rally suddenly stall into a narrow trading range, you have witnessed the market psychology that forms a harami pattern. Derived from the Japanese word for “pregnant,” the formation visually resembles a mother bar enclosing a smaller child bar. However, trading a harami successfully requires more than simply buying or selling whenever an inside bar appears on your chart.
Because the pattern represents momentum loss rather than an immediate directional breakout, traders must evaluate surrounding support and resistance levels, volume context, and next-candle confirmation. This strategy guide explains how to identify both bullish and bearish harami patterns, breaks down key execution rules with exact entry, stop-loss, and profit targets, and highlights key risk controls.
Quick Takeaways
- Two-Candle Reversal Signal: The harami is a two-bar inside-bar formation where a small second candle’s body is completely contained within the body of the preceding large candle.
- Sign of Trend Exhaustion: The sharp reduction in candle body size signals that aggressive buyers or sellers have run out of momentum, bringing the market into short-term equilibrium.
- Bullish vs Bearish Context: A Bullish Harami Candlestick forms at the end of a downtrend to signal a potential rise, while a Bearish Harami forms at the peak of an uptrend to signal a potential decline.
- Mandatory Follow-Through Confirmation: Never execute a trade based solely on the two harami candles; always wait for a third confirmation candle to close beyond the mother bar’s boundary.
- Defined Risk Parameters: The high and low boundaries of the initial mother candle provide objective structural levels for setting tight stop-loss orders.
What Is a Harami Candlestick Pattern?
A harami candlestick pattern is a two-bar price action formation where a small second candle’s real body is completely contained within the larger real body of the preceding candle, signaling a pause or potential reversal in prevailing market momentum.
To understand the market mechanics behind a harami, imagine a fast-moving vehicle slamming on its brakes. The first candle (the “mother bar”) represents the vehicle traveling at full speed in the direction of the dominant trend. The second candle (the “child bar”) represents the sudden application of the brakes—price action compresses into a small range completely inside the previous session’s span, proving that aggressive trend-following traders have lost control of the market.
Tips: Many experienced price action traders look for a significant drop in volume on the second candle of a harami setup. A low-volume inside bar following a high-volume mother bar confirms that institutional traders have stopped pressing the prevailing trend.
Anatomy of a valid harami pattern:
- Candle 1 (Mother Bar): A long, decisive candle aligned with the current trend, featuring a large real body.
- Candle 2 (Child Bar): A small candle whose open and close prices (real body) lie entirely within the open and close prices of Candle 1.
- Wick Flexibility: While traditional rules focus primarily on the real body being enclosed, higher-probability setups occur when the second candle’s entire price range (including wicks) stays within the mother bar.
Location dictates the validity of this formation. An inside bar appearing in the middle of a choppy, low-volume consolidation range is simply market noise. A harami gains technical significance only when it forms after an extended price move or directly against a key technical level.
Bullish Harami vs Bearish Harami Patterns
The harami pattern appears in two distinct directional forms depending on whether it forms at market bottoms or market tops.

1. Bullish Harami Pattern
A bullish harami candlestick pattern forms at the bottom of a downtrend and signals that selling pressure is waning, opening the door for a potential upward reversal.
- Prior Trend: Clear, sustained downtrend.
- First Candle: Large bearish (red) candle showing strong selling momentum.
- Second Candle: Small bullish (green) or neutral candle that opens higher than the previous close and stays entirely inside the first candle’s red body.
2. Bearish Harami Pattern
A bearish harami pattern forms at the peak of an uptrend and signals that buying momentum is fading, warning of a potential downward reversal.
- Prior Trend: Clear, sustained uptrend.
- First Candle: Large bullish (green) candle showing dominant buying.
- Second Candle: Small bearish (red) or neutral candle that opens with a gap down and remains enclosed within the first candle’s green body.
| Feature / Parameter | Bullish Harami Pattern | Bearish Harami Pattern |
|---|---|---|
| Prior Market Trend | Downtrend or bearish pullback | Uptrend or bullish rally |
| First Candle (Mother) | Large red (bearish) body | Large green (bullish) body |
| Second Candle (Child) | Small body enclosed in Candle 1 | Small body enclosed in Candle 1 |
| Market Sentiment | Seller exhaustion; emerging buyers | Buyer exhaustion; emerging sellers |
| Expected Direction | Upward bullish reversal | Downward bearish reversal |
Harami Pattern vs Engulfing Pattern: Key Differences
Because both formations consist of two candles, traders frequently compare the harami with the engulfing pattern. However, their structural arrangements and momentum characteristics are completely opposite.
- Harami Pattern (Inside Bar): A large candle followed by a small candle enclosed inside it. It represents momentum loss, consolidation, and market indecision. It requires next-bar confirmation before trading.
- Engulfing Pattern (Outside Bar): A small candle followed by a large candle that completely covers the previous body. It represents immediate, aggressive takeover by the opposing side.
| Feature | Harami Pattern | Engulfing Pattern |
|---|---|---|
| Candle Sequence | Large bar → Small bar | Small bar → Large bar |
| Bar Relationship | Candle 2 is inside Candle 1 | Candle 2 engulfs Candle 1 |
| Market Meaning | Pause / Momentum loss | Immediate aggressive takeover |
| Confirmation Need | High (must wait for Candle 3) | Moderate (entry often on Candle 2 close) |
The Harami Cross Variant
A specialized and highly potent variation of this formation is the Harami Cross. A Harami Cross occurs when the second candle forms a Doji—meaning its opening and closing prices are virtually identical—completely inside the real body of the mother bar.
Because a Doji represents extreme balance between supply and demand, a Harami Cross signals intense market indecision following a strong trend. When a Harami Cross forms at major horizontal support or resistance, it often generates a sharper reversal signal than a standard small-body harami.
How to Trade the Harami Candlestick Pattern (Step-by-Step)
Trading the harami pattern requires a systematic rules-based approach that combines location analysis, third-candle confirmation, and strict risk parameters.
Step 1: Confirm Location Confluence
Never trade a harami in isolation. Verify that the pattern is forming at a high-probability technical barrier:
- Major horizontal support or resistance lines.
- Key technical moving averages (e.g., 50-period or 200-period EMA).
- Confluence zones such as Fibonacci retracement levels.
Step 2: Wait for Confirmation (Candle 3)
Do not enter a trade on the close of the second candle. Wait for the third candle to close to confirm directional follow-through:
- Bullish Setup: Enter when Candle 3 closes above the high of the mother candle.
- Bearish Setup: Enter when Candle 3 closes below the low of the mother candle.
Step 3: Set Protective Stop-Loss (SL)
Place your stop-loss order just beyond the extreme wick of the mother candle:
- For a long (bullish) trade, place the SL slightly below the lowest point of Candle 1.
- For a short (bearish) trade, place the SL slightly above the highest point of Candle 1.
Step 4: Establish Take-Profit (TP) Targets
Target the next logical technical level, such as a major prior swing low or high, ensuring a minimum Risk-to-Reward Ratio of 1:2.
Step-by-Step Indian Rupee (₹) Trade Execution Example
Consider a trade setup on an Indian equity stock testing horizontal support:
- Prior Market Move: The stock drops steadily from ₹850 to ₹780 over several trading sessions.
- Harami Formation: At a known horizontal support level around ₹780, a Bullish Harami forms:
- Candle 1 (Mother Bar): Open = ₹800, High = ₹802, Low = ₹775, Close = ₹778 (large red body).
- Candle 2 (Child Bar): Open = ₹784, High = ₹790, Low = ₹782, Close = ₹788 (small green body, fully enclosed within ₹778–₹800).
- Confirmation Bar (Candle 3): The third candle opens at ₹788 and closes strongly at ₹806 (above the mother bar’s high of ₹802).
- Trade Entry: Buy position executed at ₹808 on the open of the fourth bar.
- Stop-Loss Placement: Set at ₹772 (₹3 below the mother bar’s low of ₹775).
- Risk per share = ₹808 − ₹772 = ₹36.
- Take-Profit Target: Aiming for a 1:2 Risk-to-Reward ratio:
- Target Profit per share = ₹36 × 2 = ₹72.
- Take-Profit Price = ₹808 + ₹72 = ₹880 (positioned near the prior resistance level at ₹875–₹885).
When It Works Best vs Conditions to Avoid
Understanding when to trust a harami setup helps filter out low-quality trades:
High-Probability Conditions (When It Works Best)
- Multi-Factor Confluence: The pattern forms precisely at a major historical support/resistance zone or key moving average.
- Secondary Divergence: Momentum indicators show exhaustion, such as RSI divergence, where price makes a new extreme but RSI fails to confirm.
- Volume Exhaustion: High volume on the mother bar followed by a sharp volume drop on the child bar confirms that market participation in the trend has dried up.
High-Risk Conditions (Conditions to Avoid)
- Choppy Consolidation: Harami shapes occurring in the middle of a tight, low-volume sideways range carry little technical significance.
- Pre-News Releases: Avoid trading harami setups immediately prior to high-impact economic announcements or monetary policy decisions, as news spikes can easily breach stop-loss levels.
- Trading Without Confirmation: Entering on Candle 2 before Candle 3 completes exposes traders to continuation breakouts in the original trend direction.
Common Mistakes When Trading Harami Patterns
Traders frequently encounter losses when analyzing harami patterns due to key execution errors:
1. Entering Trades Prematurely
Jumping into a trade on Candle 2 because price action looks like an inside bar is a major mistake. Until Candle 3 closes beyond the mother bar’s range, the original trend can easily resume and invalidate the pattern.
2. Confusing Wicks with Real Bodies
Strict harami rules require the real body of the second candle to sit entirely within the real body of the first candle. Ignoring body boundaries and treating any small candle as a harami increases false signal frequency.
3. Mismanaging Position Limits
Even confirmed harami setups can fail if broader market sentiment shifts. Always align your trade volume with your rupee risk limits.
Consult your risk management plan for traders to calculate correct position sizing based on your stop-loss width.
Harami Patterns in Indian Markets (NSE/BSE)
Applying harami strategies across Indian cash equities and derivative markets involves adjusting for session flow and opening gaps:
Session Dynamics on NSE and BSE
Traders on the National Stock Exchange (NSE) and Bombay Stock Exchange (BSE) track intraday timeframes (such as 5-minute or 15-minute charts) during standard session hours from 09:15 AM to 03:30 PM Indian Standard Time (IST).
- Opening Gap Effects (09:15 AM IST): Overnight news often causes Indian stocks to open with a gap up or gap down. When an opening gap places the first 15-minute candle inside the real body of the previous day’s final large candle, it forms a daily harami pattern that can set up early-morning reversal trades.
- Mid-Day Consolidation (11:30 AM – 01:30 PM IST): Volume typically tapers off during mid-day trading hours, creating frequent inside-bar shapes across Nifty 50 and Bank Nifty index contracts. These mid-day haramis should be treated with caution unless supported by major multi-day technical support or resistance.
Incorporate these session characteristics into your broader intraday trading strategy to select high-probability execution windows.
Conclusion
The harami candlestick pattern is an effective price action indicator for spotting momentum exhaustion and potential trend reversals. By identifying where a small inside candle forms within a large mother bar, traders gain early warning that prevailing buyers or sellers are losing control.
However, a harami pattern should never be traded in isolation. Always confirm the setup using multi-factor technical support or resistance, volume analysis, and third-candle follow-through before entering a position. To expand your price action skills and explore advanced technical strategies, explore our educational resources in our stock academy.
FAQs
What is a harami candlestick pattern in simple terms?
A harami candlestick pattern is a two-bar technical chart pattern where a small second candle sits completely inside the larger real body of the preceding candle. It shows that trend momentum has slowed down, signaling market indecision and a potential trend reversal.
Is a harami pattern bullish or bearish?
A harami pattern can be bullish or bearish, depending on where it forms. A Bullish Harami Candlestick appears at the bottom of a downtrend and signals a potential rise; a Bearish Harami appears at the top of an uptrend and signals a potential decline.
What is the difference between a harami and an engulfing pattern?
In a harami, a small candle follows a large candle and sits inside it (an inside bar). In an engulfing pattern, a large candle follows a small candle and completely covers it (an outside bar).
How do you trade a harami candlestick pattern?
Find a valid pattern at a major support or resistance level. Wait for a third candle to close beyond the mother candle’s boundary, enter the trade, set a stop-loss past the mother candle’s extreme wick, and target a 1:2 risk-to-reward ratio.
What is a Harami Cross?
A Harami Cross is a harami variant where the second candle is a Doji (open equals close) that sits fully inside the mother candle’s body, signaling severe indecision at a key level.
Can I trade harami candlestick patterns on NSE/BSE charts?
Yes. Harami patterns appear across liquid Indian equity stocks, stock futures, and index derivatives on platforms like Zerodha, Groww, and TradingView during IST market hours.
Disclaimer: This article was drafted with AI assistance, reviewed for accuracy by the Monetyra editorial team, and is reviewed every six months to reflect the latest market conditions and regulatory updates. It is for educational purposes only and should not be considered financial advice. Trading in financial instruments involves significant risk of loss and is not suitable for all investors, and past performance of any trading strategy does not guarantee future results. Please consult with a licensed financial advisor before making any trading decisions.
In India, equity and derivative trading is regulated by the Securities and Exchange Board of India (SEBI). Investors are advised to trade only through licensed brokers and adhere to all regulatory guidelines issued by SEBI and domestic exchanges.