Marubozu Candlestick Pattern
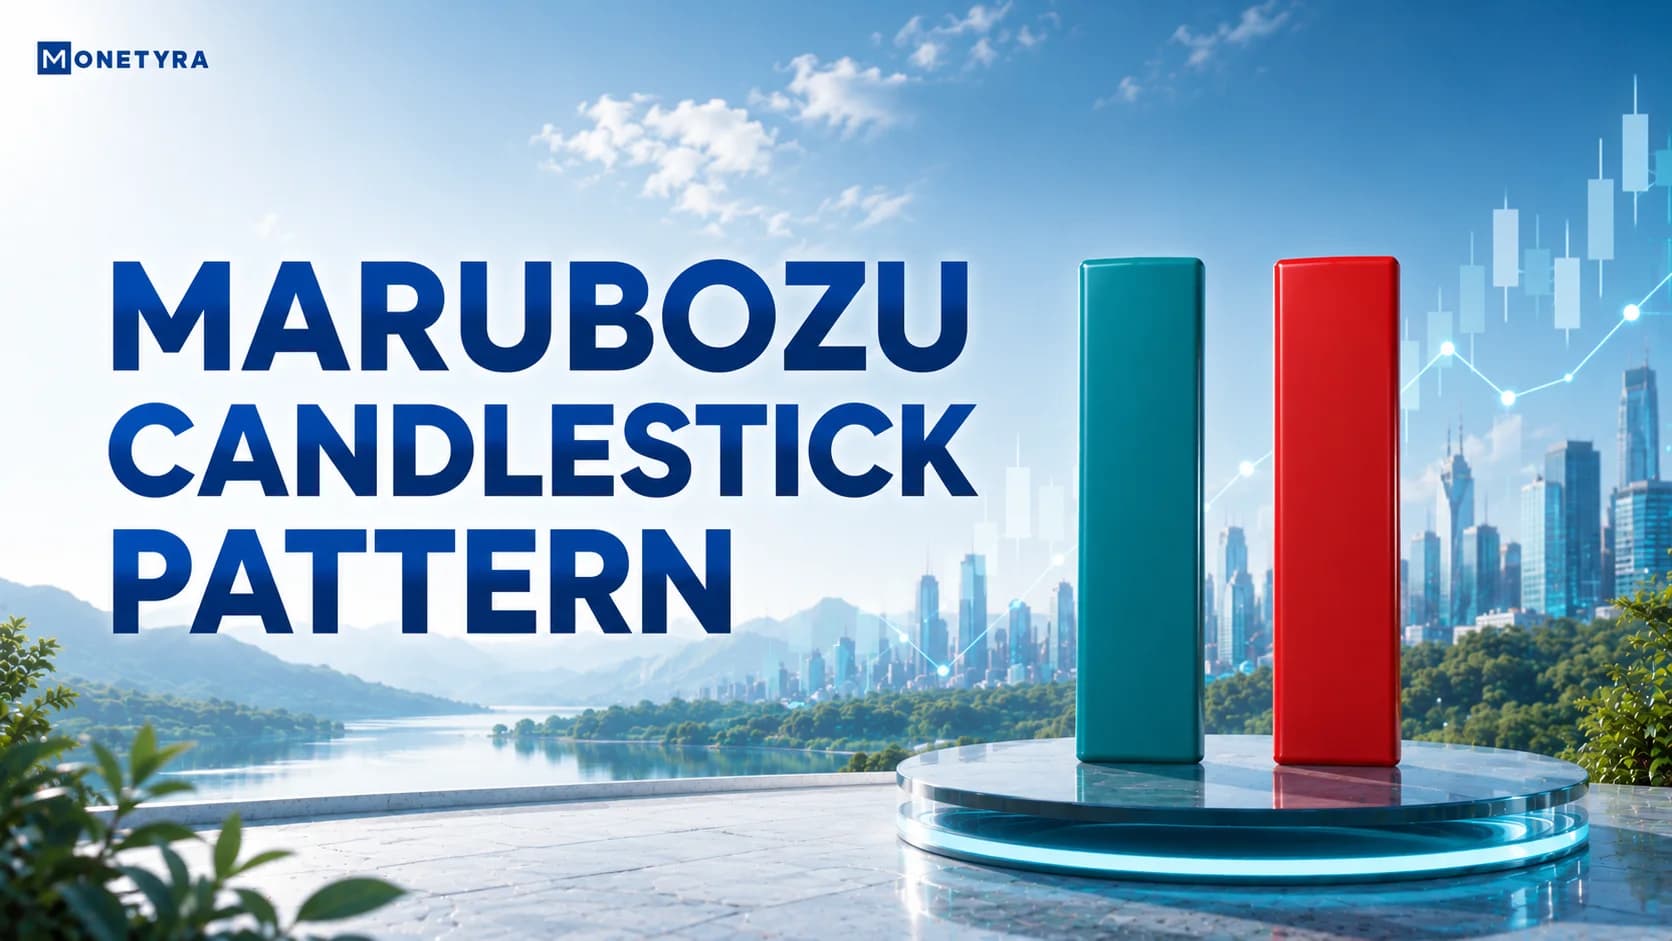
A marubozu candlestick pattern is a single-bar price action setup characterized by a large, long real body with no (or virtually non-existent) upper or lower wicks, signaling that buyers or sellers maintained total directional control throughout the session. It indicates that one side of the market dominated trading from the opening bell to the session close without experiencing significant price rejection.
If you have ever watched a stock open and immediately surge in one direction without taking a single breath, you have witnessed the raw institutional momentum that forms a Marubozu. Derived from the Japanese word for “shaved” or “bald,” this pattern visually stands out on a chart like a monolith of pure buying or selling conviction.
However, entering a trade purely because a candle looks long and powerful can trap retail traders into buying at the top of an exhausted move or shorting at the very bottom. Succeeding with Marubozu setups requires evaluating structural location, verifying volume expansion, waiting for key breakout confirmations, and maintaining strict risk controls. This guide breaks down the three structural variants of the pattern, compares bullish against bearish formations, details a step-by-step trading framework, and outlines essential risk management rules for active traders.
Quick Takeaways
- Total Directional Dominance: A Marubozu is a single-candle price action formation characterized by a large real body with no (or negligible) wicks, signaling that one side (buyers or sellers) controlled the market from open to close.
- Pure Conviction Alert: Serves as a strong visual indication of high momentum, frequently appearing during major technical breakouts, trend continuations, or high-volume news announcements.
- Three Structural Variants: Exists in three primary variations—Marubozu Full (no wicks), Marubozu Open (flat open, small wick at close), and Marubozu Close (wick at open, flat close).
- Context Over Isolation: Never buy or sell a Marubozu candle in isolation; entering late on an extended Marubozu increases risk if price undergoes a natural mean-reversion pullback.
- Structural Stop-Loss Anchors: Protective stop-loss placement is anchored to the origin of the Marubozu candle (the low of a bullish Marubozu or high of a bearish Marubozu).
Disclaimer: This article is for educational purposes only and does not constitute financial advice. Trading in financial instruments involves significant risk of loss and is not suitable for all investors. Past performance of any trading strategy does not guarantee future results.
What Is a Marubozu Candlestick Pattern?
Before exploring the marubozu candle meaning in greater technical depth, it helps to see the pattern as a single-bar price action setup characterized by a large, long real body with no (or virtually non-existent) upper or lower wicks, signaling that buyers or sellers maintained total directional control throughout the session.
To understand why a Marubozu carries such heavy weight on technical charts, consider the underlying mechanics of institutional order flow:
- Immediate Aggression: From the exact moment trading opens, institutional order flow overwhelms the counter-side. Buyers or sellers aggressively absorb liquidity without allowing price to drift beyond the opening level.
- Uninterrupted Trend: Throughout the session, price moves continuously in a single direction. There are no major intraday pullbacks or profit-taking spikes that would normally create long upper or lower wicks.
- Closing Dominance: The session ends with price closing directly at or right next to the extreme high or low of the bar. This signals that the dominant group remained eager to hold positions into the close.
Tips: Many traders track volume when evaluating Marubozu candles. A Marubozu that forms on heavy, above-average trading volume signals institutional participation and accumulation, whereas a long candle printed on below-average volume during illiquid market hours can be a false breakout trap.
Traders categorize Marubozus as either continuation signals or breakout triggers depending on where they form relative to established support and resistance zones. When a Marubozu punches through a multi-week consolidation range on expanding volume, it demonstrates genuine breakout momentum rather than routine price drift.
Structural Anatomy and the Three Types of Marubozu Candlesticks
While a textbook Marubozu has zero wicks, real-world charts display three distinct variations based on where minor wicks appear.
1. Marubozu Full (Open & Close)
The Marubozu Full is the purest representation of directional conviction. It features zero upper or lower wicks.
- Bullish Full: Open = Low, and Close = High.
- Bearish Full: Open = High, and Close = Low.
2. Marubozu Open
The Marubozu Open has a completely flat opening price (no wick at the open), but features a minor shadow at the session close.
- Bullish Open: The session opens at its absolute low and rallies strongly, but experiences a slight pullback before the close, leaving a tiny upper wick.
- Bearish Open: The session opens at its absolute high and falls continuously, but experiences minor short-covering before the close, leaving a tiny lower wick.
3. Marubozu Close
The Marubozu Close features a small shadow at the session open, but closes flat at its extreme high or low.
- Bullish Close: Price dips slightly below the opening level before buyers take command and drive price to close at its exact session high.
- Bearish Close: Price pushes slightly above the opening level before sellers take over and drive price to close at its exact session low.
| Marubozu Type | Open Wick Parameter | Close Wick Parameter | Conviction Level | Primary Interpretation |
|---|---|---|---|---|
| Marubozu Full | Absent (0%) | Absent (0%) | Maximum | Uncontested dominance from open to close |
| Marubozu Open | Absent (0%) | Small Wick | Very High | Immediate drive at open; minor closing pause |
| Marubozu Close | Small Wick | Absent (0%) | Very High | Early session fight followed by total close control |
Bullish Marubozu vs Bearish Marubozu: Key Differences Explained
Understanding the structural differences in a bullish marubozu candlestick pattern versus a bearish marubozu candlestick pattern allows traders to align their bias with prevailing institutional market flow.
- Bullish Marubozu: A tall green or white real body where the opening price equals the low and the closing price equals the high. It indicates aggressive accumulation, where buyers willingly bid up prices continuously throughout the session.
- Bearish Marubozu: A tall red or black real body where the opening price equals the high and the closing price equals the low. It represents aggressive distribution or panicky dumping, where sellers hit bid prices relentlessly into the close.
| Feature / Parameter | Bullish Marubozu | Bearish Marubozu |
|---|---|---|
| Candle Color | Green or White | Red or Black |
| Price Relationship | Open = Low, Close = High | Open = High, Close = Low |
| Market Dominance | Buyers completely control order flow | Sellers completely control order flow |
| Strategic Action | Look for breakout long entries or trend continuations | Look for breakdown short entries or trend continuations |
| Stop-Loss Anchor | Positioned just below the Marubozu Open (Low) | Positioned just above the Marubozu Open (High) |
How to Trade the Marubozu Pattern (Step-by-Step)
Executing trades using a marubozu candlestick pattern strategy requires location verification, volume confirmation, and structured risk parameters.
Step 1: Identify Structural Location Context
Never buy or sell a Marubozu in isolation. Verify that the candle forms at a key technical juncture:
- Breaking out above a horizontal resistance ceiling or below a support floor.
- Emerging from a multi-session consolidation wedge or flag pattern.
- Bouncing decisively off a major dynamic moving average (such as the 50-period EMA).
Step 2: Verify Volume Expansion
A valid Marubozu must be backed by institutional volume. Check that the trading volume on the Marubozu bar is significantly higher than the 20-period average volume bar.
Step 3: Choose Entry Mechanics
Traders choose between two execution approaches based on market momentum:
- Direct Breakout Entry: Enter market-long on the close of the Marubozu bar (or the opening tick of the subsequent bar) during high-momentum breakouts.
- Retracement Pullback Entry: Wait for price to pull back 38.2% or 50% into the real body of the Marubozu candle on lower volume before entering, offering a tighter stop-loss.
Step 4: Set Protective Stop-Loss (SL)
Anchor your stop-loss order slightly beyond the origin of the Marubozu candle:
- For a Bullish Marubozu, place the stop-loss just below the opening price (the lowest wick or base).
- For a Bearish Marubozu, place the stop-loss just above the opening price (the highest wick or top).
Step 5: Establish Take-Profit (TP) Targets
Target key historical support/resistance levels or structure profit targets using a minimum 1:2 Risk-to-Reward ratio.
Step-by-Step Indian Rupee (₹) Trade Execution Example
Consider a trade example on an Indian cash equity stock breaking out of a tight trading range:
- Consolidation Setup: An NSE equity stock trades in a tight consolidation range between ₹2,360 and ₹2,400 for two weeks.
- Marubozu Breakout Candle: A tall green candle forms, opening at ₹2,362, rallying continuously without upper or lower wicks, and closing at ₹2,480 on 3× average volume.
- Trade Entry: Market-long position executed at ₹2,480 on the close of the Marubozu candle.
- Stop-Loss Placement: Set at ₹2,356 (₹6 buffer below the Marubozu opening low of ₹2,362).
- Total Risk per share = ₹2,480 − ₹2,356 = ₹124.
- Take-Profit Target: Aiming for a 1:2 Risk-to-Reward ratio:
- Target Profit per share = ₹124 × 2 = ₹248.
- Take-Profit Price = ₹2,480 + ₹248 = ₹2,728 (positioned just below major monthly overhead resistance).
High-Probability Conditions vs Setup Failures
Evaluating momentum and technical confluence helps filter out false Marubozu signals:
High-Probability Conditions (When It Works Best)
- Fresh Range Breakouts: Marubozu candles that slice through long-standing horizontal resistance or support boundaries carry high follow-through rates.
- Momentum Oscillator Confluence: Alignment with indicator momentum, such as MACD histogram expansion or RSI divergence resolutions.
- Heavy Institutional Volume: Volume expansion confirming that institutional buyers or sellers are aggressively driving the move.
High-Risk Conditions (The Exhaustion Trap)
- Climax Marubozus at Extended Trends: A massive Marubozu appearing after an extended 8-to-10 candle rally often represents a blow-off climax (retail FOMO) rather than a fresh breakout.
- Low Volume Marubozus: Long-bodied candles printed during thin, illiquid holiday trading sessions lack real institutional backing and frequently reverse.
- Trading Directly Into Heavy Opposing Levels: Buying a bullish Marubozu that closes directly against major multi-year weekly resistance increases the risk of an immediate pullback.
Common Execution Mistakes to Avoid
Traders frequently fall into predictable traps when trading large-range momentum candles:
1. Chasing Exhaustion Candles (FOMO Buying)
Buying the top of an exceptionally long Marubozu candle that has already moved 6% to 8% in a single session exposes traders to severe drawdowns if price undergoes a mean-reversion pullback. Wait for a minor consolidation or pullback before entering.
2. Ignoring Volume Verification
Assuming every wickless candle guarantees continuation without checking volume is dangerous. True institutional accumulation always leaves a volume footprint.
3. Placing Stop-Losses Inside the Body
Placing a protective stop-loss in the middle of a Marubozu body leaves positions vulnerable to normal intra-bar pullbacks. Always anchor the stop-loss beyond the origin (open) of the candle.
Review your position sizing parameters within a broader risk management plan for traders to handle the wider stop-loss distances required by large Marubozu candles.
Marubozu Candlestick Patterns in Indian Markets (NSE/BSE)
Applying Marubozu patterns on Indian stock exchanges requires recognizing local session schedules and volatility patterns:
Session Dynamics on NSE and BSE
Traders on the National Stock Exchange (NSE) and Bombay Stock Exchange (BSE) monitor intraday charts (such as 5-minute and 15-minute timeframes) during exchange hours from 09:15 AM to 03:30 PM Indian Standard Time (IST).
- Opening Bell Momentum (09:15 – 09:30 AM IST): Major corporate earnings announcements or overnight global cues often cause aggressive institutional buying at the open. A 15-minute Bullish Marubozu printed on the Nifty 50 or Bank Nifty index during the opening bar frequently establishes the dominant trend direction for the remainder of the session.
- Derivative Breakouts in Stock Futures: Equity futures traders evaluate Marubozu candles forming on daily charts to identify strong multi-day momentum continuations.
Incorporate session-specific timing rules into your overarching intraday trading strategy to avoid false breakouts during low-liquidity mid-day sessions.
Conclusion
The marubozu candlestick pattern provides traders with a clear visual representation of total market conviction. By removing upper and lower wicks, it demonstrates that one side of the market dominated price action uninterrupted from open to close.
However, trading large-range candles successfully requires discipline. Always verify that the setup occurs at a significant technical boundary, confirm heavy institutional volume, and anchor protective stop-loss orders beyond the candle’s origin. To expand your technical analysis knowledge and master price action strategies, explore the resources available in our stock academy.
FAQs
A marubozu candlestick pattern is a single-bar price action formation with a long body and no wicks. It indicates that buyers or sellers controlled the price from the session open directly to the session close.
A Marubozu can be either bullish or bearish. A green (bullish) Marubozu opens at its low and closes at its high. A red (bearish) Marubozu opens at its high and closes at its low.
The three types are Marubozu Full (no wicks at all), Marubozu Open (flat opening price with a tiny wick at the close), and Marubozu Close (tiny wick at the open with a flat closing price).
Identify a Marubozu breaking out of a key support or resistance level, confirm high volume, enter on the close or on a 38.2% body pullback, place a stop-loss beyond the candle’s open, and target a 1:2 Risk-to-Reward ratio.
No. While a Marubozu signals strong momentum, candles that appear at the end of long, extended trends can signal climax exhaustion rather than trend continuation.
A true Marubozu strictly has zero (or negligible) upper and lower wicks. Standard momentum candles can have moderate wicks while still maintaining a relatively large real body.
AI Disclosure: This article was created with AI assistance and reviewed for accuracy by the Monetyra editorial team before publication, and is reviewed every six months to reflect the latest market conditions and regulatory updates.
Disclaimer: Disclaimer: This article is for educational purposes only and should not be considered financial advice. Trading in financial instruments involves significant risk of loss and is not suitable for all investors, and past performance of any trading strategy does not guarantee future results.
Please consult with a licensed financial advisor before making any trading decisions. In India, equity and derivative trading is regulated by the Securities and Exchange Board of India (SEBI). Investors are advised to trade only through licensed brokers and adhere to all regulatory guidelines issued by SEBI and domestic exchanges.