Maximum Drawdown in Trading: Meaning & Formula
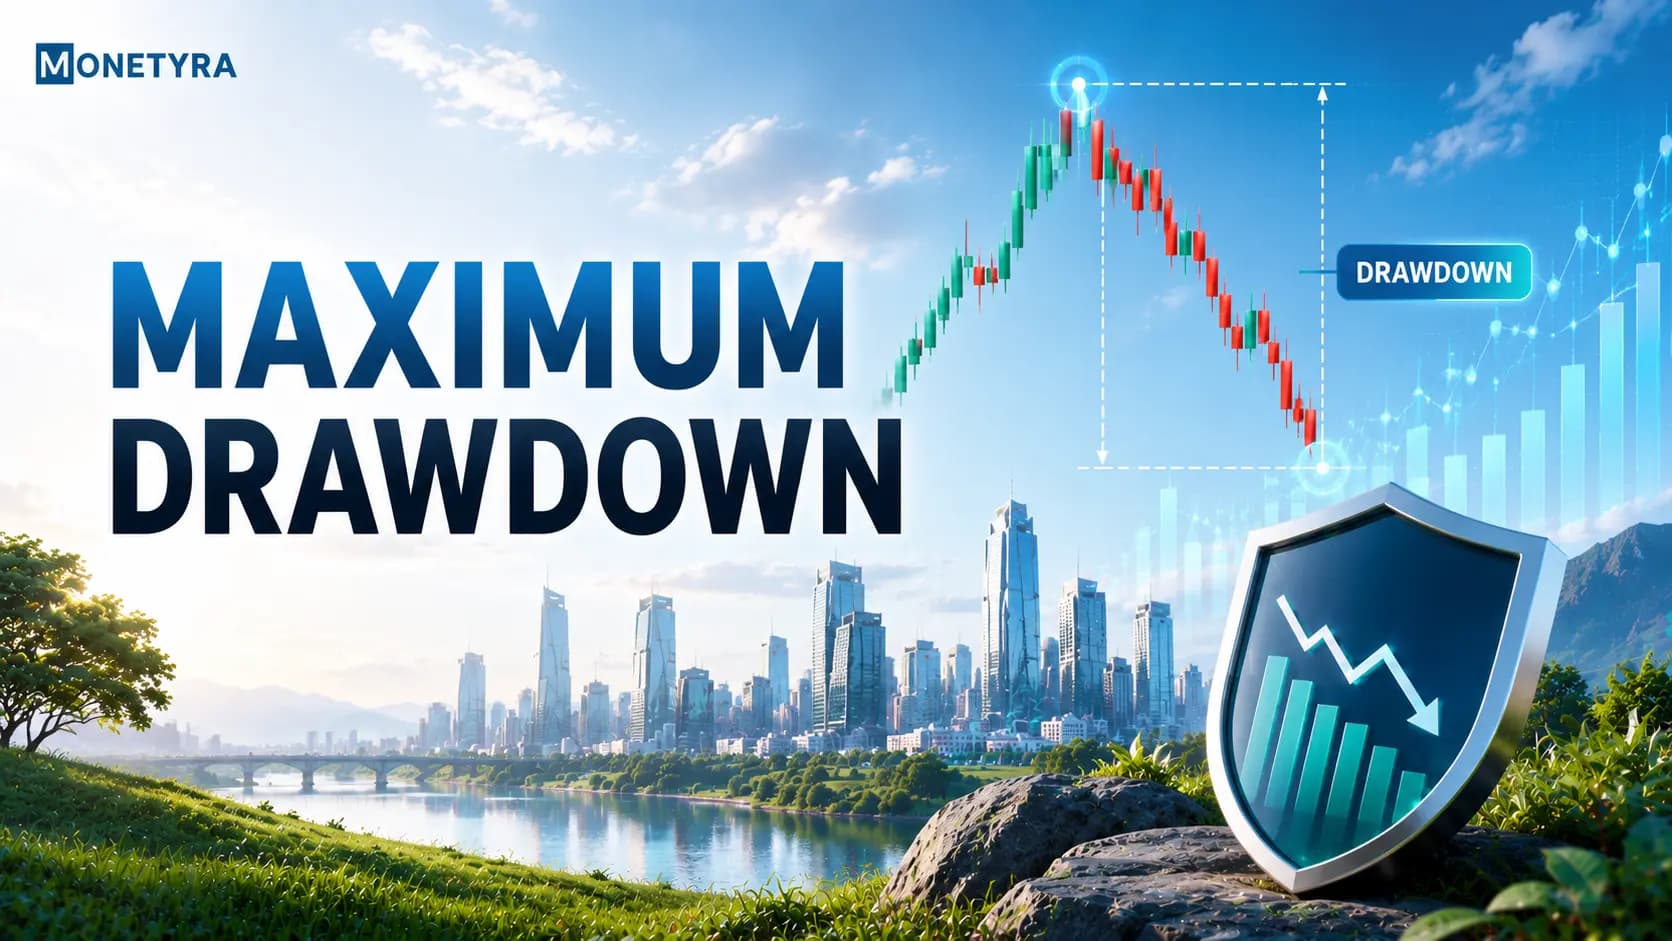
The maximum drawdown is a core risk management metric that measures the largest observed peak-to-trough decline in a trading account or portfolio equity curve before a new peak is attained, expressed as a percentage of the peak value. It quantifies the worst-case capital loss an investor or strategy experienced over a specific historical period, offering an objective assessment of downside tail risk and capital preservation efficiency.
If you have ever watched a trading account reach an all-time high, suffer a series of consecutive losses, and felt the psychological pain of watching your capital shrink before slowly clawing your way back to breakeven—you have experienced a drawdown. While many retail traders focus exclusively on upside return percentages, institutional investors and professional fund managers evaluate strategies primarily through the lens of drawdown containment. Understanding your strategy’s maximum drawdown is vital because capital loss recovery is mathematically non-linear: losing 50% of your account requires a 100% gain just to return to where you started.
However, relying solely on historical drawdown figures without accounting for changing market regimes or tail-risk events can lead to a false sense of security. Mastering this concept requires calculating exact peak-to-trough depths, navigating the non-linear math of recovery, evaluating risk-adjusted return ratios like Calmar and Sortino, and implementing systematic risk controls. This guide breaks down the mathematical calculation of maximum drawdown, explores the drawdown recovery percentage trap, provides concrete Indian market portfolio examples, and details essential risk parameters for active traders.
Quick Takeaways
- Peak-to-Trough Downside Metric: Maximum drawdown measures the largest percentage decline from an equity curve peak to its subsequent lowest trough before a new peak is formed.
- Non-Linear Recovery Math: Capital recovery requires exponentially higher gains as drawdowns deepen; a 20% loss requires a 25% gain to recover, while a 50% loss demands a 100% return.
- Risk-Adjusted Performance Evaluation: Ratios such as the Calmar Ratio combine annual returns with maximum drawdown to measure how efficiently a trader generates profits relative to historical pain.
- Position Sizing and Capital Limits: Controlling maximum drawdown requires embedding fixed percentage risk limits (such as 1% to 2% per trade) within a structured risk management plan for traders.
- Behavioral Loss Mitigation: Establishing a pre-defined daily or weekly drawdown limit prevents emotional revenge trading during severe equity dips.
Disclaimer: This article is for educational purposes only and should not be considered financial advice. Trading in financial instruments involves significant risk of loss and is not suitable for all investors; past performance of any trading strategy does not guarantee future results. Please consult with a licensed financial advisor before making any trading decisions.
What Is Maximum Drawdown (MDD) in Trading?
The drawdown meaning in trading centers on one core risk management metric: maximum drawdown, which measures the largest observed peak-to-trough decline in a trading account or portfolio equity curve before a new peak is attained, expressed as a percentage of the peak value. Understanding drawdown in trading is essential before applying any position-sizing or risk-control strategy.
To understand how maximum drawdown functions within portfolio management, consider its three primary structural phases:
- The Equity Peak: The highest valuation point achieved by an account or portfolio during a specified evaluation period.
- The Trough (Lowest Low): The lowest valuation point reached before price or equity makes a new all-time high. The distance between the Peak and the Trough defines the drawdown depth.
- The Recovery (Underwater Duration): The time elapsed and percentage return required for the equity curve to rebuild from the trough back to the previous peak level.
Tips: Traders often distinguish between Peak-to-Trough Drawdown and Peak-to-Current Drawdown. Peak-to-Trough reflects the worst historical dip, whereas Peak-to-Current measures how far below the peak your live account sits today. Always track both to ensure your current drawdown remains well within historical backtested limits.
When evaluated across daily or monthly performance records, monitoring your maximum drawdown prevents unexpected market volatility from causing catastrophic capital destruction.
How to Calculate Maximum Drawdown (Formula & Step-by-Step)
Calculating maximum drawdown requires identifying the absolute highest peak prior to the lowest trough across a defined trading history.
The Basic Formula
Maximum Drawdown (₹) = Peak Value (₹) – Trough Value (₹)
Maximum Drawdown (%) = (Peak Value – Trough Value) / Peak Value x 100
Step-by-Step Indian Rupee (₹) Portfolio Example
Consider an active swing trading portfolio on the National Stock Exchange (NSE) tracked over a 12-month period:
- Starting Capital: ₹10,00,000
- Month 3 Peak: Portfolio grows to an all-time high of ₹12,00,000
- Month 6 Trough: Following a market correction, portfolio drops to ₹8,00,000
- Month 9 Recovery: Portfolio recovers back to ₹10,00,000
- Month 12 New Peak: Portfolio reaches a fresh high of ₹13,50,000
Step 1: Calculate the Monetary Drawdown Amount
Monetary Drawdown = ₹12,00,000 (Peak) – ₹8,00,000 (Trough) = ₹4,00,000
Step 2: Calculate the Percentage Maximum Drawdown
Maximum Drawdown (%) = ₹4,00,000 / ₹12,00,000 x 100 = 33.33%
Notice that the drawdown is calculated relative to the peak value of ₹12,00,000, not the initial starting capital of ₹10,00,000.
The Non-Linear Math of Drawdown Recovery
A critical concept in risk management is the mathematical asymmetry between drawdown losses and the required recovery percentage. Because losses reduce the baseline capital available for subsequent trades, each loss requires a larger percentage return on remaining capital to reach breakeven.
Required Recovery Percentage = (1 / (1 – Drawdown Decimal) – 1) x 100
| Account Drawdown Depth (%) | Remaining Capital (from ₹10,00,000) | Required Recovery Gain (%) | Difficulty Level / Market Impact |
|---|---|---|---|
| 5% | ₹9,50,000 | 5.26% | Minor routine equity fluctuation |
| 10% | ₹9,00,000 | 11.11% | Manageable single-month correction |
| 20% | ₹8,00,000 | 25.00% | Standard bear market pullback |
| 30% | ₹7,00,000 | 42.86% | Severe structural drawdown |
| 40% | ₹6,00,000 | 66.67% | Major capital impairment |
| 50% | ₹5,00,000 | 100.00% | Requires doubling remaining capital |
| 60% | ₹4,00,000 | 150.00% | Severe impairment; high recovery time |
| 75% | ₹2,50,000 | 300.00% | Near-total capital destruction |
As shown in the table, once a drawdown deepens beyond 20% to 30%, the recovery requirement increases exponentially. Keeping account drawdowns contained within modest boundaries (under 15% to 20%) is essential for maintaining mathematical sustainability over multi-year periods.
Maximum Drawdown vs Volatility Metrics
Investors frequently compare maximum drawdown with standard volatility metrics like standard deviation or variance:
- Standard Deviation (Volatility): Measures the overall dispersion of returns around an average, treating both upside spikes and downside dips as equal volatility.
- Maximum Drawdown: Measures downside tail risk specifically, capturing the worst continuous drop experienced from a high point.
Evaluating Risk-Adjusted Ratios
Professional fund managers use performance metrics that incorporate maximum drawdown:
- Calmar Ratio: Compares annualized returns directly against the maximum drawdown.
Calmar Ratio = Annualized Return / Maximum Drawdown
A higher Calmar ratio (e.g., above 2.0) indicates strong returns achieved with low historical drawdown severity. - Sortino Ratio: Evaluates returns relative only to downside risk, filtering out positive upside volatility.
What Is an “Acceptable” Maximum Drawdown?
Acceptable drawdown limits vary based on asset class, trading strategy duration, and individual risk appetite:
- Conservative Investors / Mutual Funds: Aim for maximum drawdowns under 10% to 15%.
- Active Swing Traders: Typically operate within 15% to 25% drawdown allowances.
- Aggressive Intraday / Futures Traders: May experience drawdowns of 20% to 30% during choppy market regimes.
Tips: When backtesting a trading strategy, always multiply the backtested historical maximum drawdown by 1.5× to 2.0× to establish your real-world risk allowance. Real market execution slippage, black-swan gaps, and changing market regimes frequently cause live drawdowns to exceed historical simulations.
High-Probability Execution Practices vs Common Drawdown Traps
Controlling drawdowns requires combining analytical metrics with behavioral trading discipline:
High-Probability Drawdown Control Practices

- Fixed Percentage Capital Allocation: Limit exposure on individual trades to 1% or 2% of total account capital using proper risk reward ratio calculations.
- Daily and Weekly Loss Limits: Establish automated circuit breakers (e.g., stopping trading for the day if account equity drops by 3% in a single session).
- Dynamic Position Reduction: Gradually reduce trade sizing during drawdown phases (e.g., cutting position size by half when equity drops 10% below peak) until profitability returns.
Common Execution Mistakes to Avoid
- Revenge Trading After Losses: Increasing trade size or leverage during a drawdown to “make back losses quickly” almost always accelerates capital depletion.
- Ignoring Technical Exit Conditions: Removing stop-loss orders on losing positions because you expect price to bounce, turning minor losses into deep structural drawdowns.
- Failing to Align Entries with Strategy Rules: Chasing extended moves outside established breakout trading strategy parameters increases failure rates.
Maximum Drawdown in Indian Stock Markets (NSE/BSE)
Managing drawdowns across Indian cash equities, index derivatives, and stock futures involves adapting to exchange volatility cycles and session dynamics:
Session Dynamics and Risk Controls
- Opening Overnight Gaps (09:15 AM Indian Standard Time (IST)): Global market movements during non-Indian hours can cause overnight price gaps on the NSE and Bombay Stock Exchange (BSE). Position traders using an intraday trading strategy or swing model must account for gap risk when calculating worst-case portfolio drawdowns.
- Derivative Leverage Impact: Trading leveraged Nifty 50 or Bank Nifty futures contracts magnifies equity curve fluctuations. A 2% adverse index move can translate into a 10% to 15% account drawdown if derivative leverage is unmanaged.
- Regulatory Oversight: Adhering to margin frameworks mandated by the Securities and Exchange Board of India (SEBI) ensures that leverage limits are respected, helping prevent catastrophic account drawdowns.
Conclusion
Maximum drawdown is one of the most critical metrics for evaluating long-term portfolio survival and trading strategy efficiency. By tracking peak-to-trough declines, respecting the non-linear math of recovery, and establishing firm risk parameters, traders can protect their capital against catastrophic market events.
However, tracking drawdown alone is not enough. Sustainable trading performance requires disciplined execution, proper position sizing, emotional control, and adherence to proven risk management principles. To deepen your trading knowledge and master risk controls, explore our educational resources in our stock academy.
FAQs
Maximum drawdown measures the largest percentage loss your trading account or portfolio experienced from its highest peak to its lowest point before making a new high. It shows the worst historical drop in account value.
Subtract the lowest trough value from the highest peak value, divide the result by the peak value, and multiply by 100 to get the percentage. For example, if an account drops from ₹10,00,000 to ₹7,50,000, the maximum drawdown is 25%.
An acceptable drawdown depends on your strategy and risk tolerance. Conservative investors target drawdowns under 10% to 15%, while active swing and intraday traders generally keep drawdowns contained within 15% to 25%.
Volatility measures overall price fluctuations in both directions around an average, whereas maximum drawdown specifically measures downside peak-to-trough capital loss.
Traders reduce maximum drawdown by enforcing strict position sizing (1% to 2% risk per trade), using protective stop-losses, applying daily loss limits, and scaling down position size during losing streaks.
AI Disclosure: This article was created with AI assistance and reviewed for accuracy by the Monetyra editorial team before publication, and is reviewed every six months to reflect the latest market conditions and regulatory updates.
Disclaimer: This article is for educational purposes only and should not be considered financial advice. Trading in financial instruments involves significant risk of loss and is not suitable for all investors. Please consult with a licensed financial advisor before making any trading decisions.