Short Covering Meaning in Trading and Market Rallies

Sharp upward price spikes in a declining stock often surprise traders who expect further weakness. Understanding the short covering meaning helps market participants separate a temporary exit-driven bounce from sustained institutional accumulation.
In Indian equity and derivatives markets, every short sale creates an obligation to buy back the shares or contracts later. When multiple short sellers close their positions simultaneously, the resulting demand can push prices higher within minutes, even without fresh fundamental buying.
Quick Takeaways
- Short covering is the purchase of shares or derivative contracts to close an existing short position after selling first.
- Concentrated buy-back orders often trigger sharp, short-lived rallies because sellers are exiting rather than long-term buyers accumulating stock.
- Rising prices paired with falling open interest signal short covering, though sudden reversals remain a risk once exit orders finish.
What Is Short Covering Meaning in Trading?
Short covering is the purchase of shares or derivative contracts by a trader to close out an existing open short position.
To understand this mechanism, it helps to review how long and short positions work in financial markets. A trader initiates a short trade by selling an asset first with the expectation that its price will decline. Closing that trade requires an offsetting buy order of the exact same quantity.
In India, the Securities and Exchange Board of India (SEBI) prohibits naked short selling across cash and derivatives segments. Retail and institutional participants on the National Stock Exchange (NSE) generally execute short trades through three permitted channels: selling cash equities intraday and squaring off before market close at 3:30 PM IST, selling stock or index futures contracts, or borrowing shares via the Securities Lending and Borrowing (SLB) mechanism.
A Hypothetical Market Example
In this hypothetical example, a trader analyzes Stock A on the NSE, which trades at ₹1,000 per share, and expects a downward move following weak sector data:
- Opening the Short Position: The trader sells one futures lot of Stock A representing 100 shares, creating a total contract value of ₹1,00,000 against an initial margin deposit.
- Profitable Short Covering: If Stock A drops to ₹800 over the next few sessions, the trader buys back the futures lot at ₹800 (a contract value of ₹80,000). This buy order closes the obligation and locks in a gross profit of ₹20,000 before brokerage and statutory charges.
- Loss-Cutting Short Covering: If unexpected positive news drives Stock A up to ₹1,100 instead, the trader executes a stop-loss buy order at ₹1,100 (a contract value of ₹1,10,000) to prevent deeper losses, realizing a gross loss of ₹10,000.
How Does a Short Covering Rally Happen?
A short covering rally occurs when a sudden wave of buy-back orders from short sellers pushes an asset’s price sharply higher over a brief period.
Because short sellers face theoretically unlimited upside risk if a stock keeps climbing, adverse price movements force traders to close positions quickly. Common triggers include unexpected corporate earnings, positive macroeconomic announcements, or a technical breakout above a key resistance level. When rising prices force multiple short sellers to hit their stop-loss levels at the same time, the resulting feedback loop is known as a short squeeze.
While the immediate price action looks bullish on a chart, the underlying market dynamic differs from a primary uptrend. Sustainable rallies rely on fresh capital from long-term investors accumulating shares based on fundamentals. In contrast, short covering represents existing sellers exiting the market. Once those short positions are closed, the artificial buying pressure disappears, and the stock may resume its prior downtrend if new buyers fail to step in.
How Open Interest Signals Short Covering
In the Futures and Options (F&O) segment, derivatives traders track price movement alongside open interest in derivatives trading to distinguish exit-driven bounces from fresh accumulation.
When a futures contract’s price rises while total open interest declines, it indicates short covering. Existing short sellers are buying back contracts to close their trades, reducing the total number of unsettled contracts in the market. For traders looking to evaluate strike-wise positioning and volume shifts across contracts, conducting a detailed open interest analysis provides deeper confirmation.
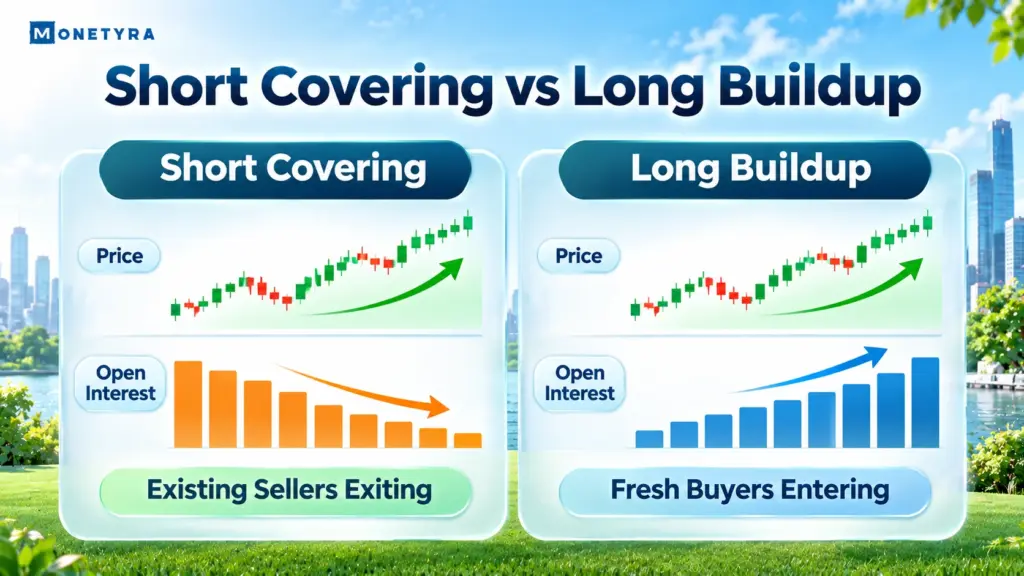
| Market State | Price Direction | Open Interest (OI) | Underlying Participant Activity |
|---|---|---|---|
| Short Covering | Rising | Falling | Short sellers buying back contracts to close positions |
| Long Buildup | Rising | Rising | New buyers opening fresh long positions |
| Short Buildup | Falling | Rising | New sellers opening fresh short positions |
| Long Unwinding | Falling | Falling | Long holders selling existing positions to exit |
It is also useful to separate short covering from long unwinding, as both states show falling open interest while positions are closed. While short covering pushes prices higher as sellers buy back, long unwinding drives prices lower when existing buyers sell their holdings to book profits or cut losses.
Market Context and Risk Factors to Watch
Evaluating historical derivatives sessions helps clarify how short covering behaves during volatile market phases, particularly around monthly F&O expiry weeks on the NSE.
Treating every sharp green candle as a confirmed trend reversal exposes traders to specific market risks:
- Bull Traps: Entering a long trade late during a short-covering spike can result in immediate losses if buying volume dries up once shorts finish squaring off.
- Expiry Distortion: During the final week of a monthly derivatives series, routine position squaring and rollovers can distort open interest readings without signaling a broader directional shift.
- Volatility Spikes: Rapid short squeezes often widen bid-ask spreads and trigger slippage on market orders, making strict position sizing and stop-loss discipline necessary.
Monetyra’s Take
Short covering offers valuable clues about market positioning, especially when an oversold stock rebounds sharply on declining open interest. However, relying on exit-driven rallies as a standalone entry signal carries high reversal risk because the buying pressure is temporary by nature. Waiting for open interest to expand alongside rising prices provides a more reliable indication that fresh institutional capital is supporting the move.
Conclusion
Short covering occurs when traders buy back shares or derivative contracts to close existing short positions, creating immediate upward price pressure. While these buy-back waves can spark rapid rallies or short squeezes, they reflect position exits rather than fresh long-term demand. Tracking price movements alongside open interest helps distinguish temporary short-covering bounces from genuine bullish accumulation.
Deepen Your Market Positioning Analysis
Read structured frameworks on derivatives positioning, market breadth, and price action indicators.
FAQs
1. What is short covering?
Short covering is the purchase of shares or derivative contracts to close an open short position. Traders who initially sold an asset expecting a price drop must buy back the exact same quantity to finalize the trade, return borrowed shares, and realize either a profit or a loss.
2. Is short covering bullish or bearish?
Short covering generates short-term bullish price action because buy-back orders create immediate demand. However, it reflects a neutral-to-bearish underlying context since the upward move is driven by traders exiting prior bearish bets rather than institutional investors accumulating shares for long-term growth.
3. What is short covering in the stock market with an example?
In this hypothetical example, a trader short-sells 100 shares of a stock intraday at ₹500 per share, expecting the price to fall. When the stock drops to ₹420 later in the session, the trader buys back 100 shares at ₹420 to square off the trade, completing the short covering process.
4. What happens to share prices during short covering?
Share prices typically rise during short covering, often at a rapid pace. When multiple short sellers simultaneously place buy orders to lock in profits or trigger stop-losses, the concentrated demand absorbs available supply and pushes the stock price higher in the short term.
5. How do you identify short covering in open interest?
In futures and options trading, short covering is identified when an asset’s price rises while total open interest decreases. This combination shows that market participants are closing out existing short contracts rather than opening new bullish positions.
Disclaimer: This article was written with the help of AI and edited by the Monetyra editorial team. It is for educational purposes only and should not be considered financial advice. Trading and investing in financial instruments involve significant risk of loss and are not suitable for all investors. Please consult a licensed financial advisor before making any investment or trading decision.