Range Trading Strategy: How to Trade Range-Bound Markets
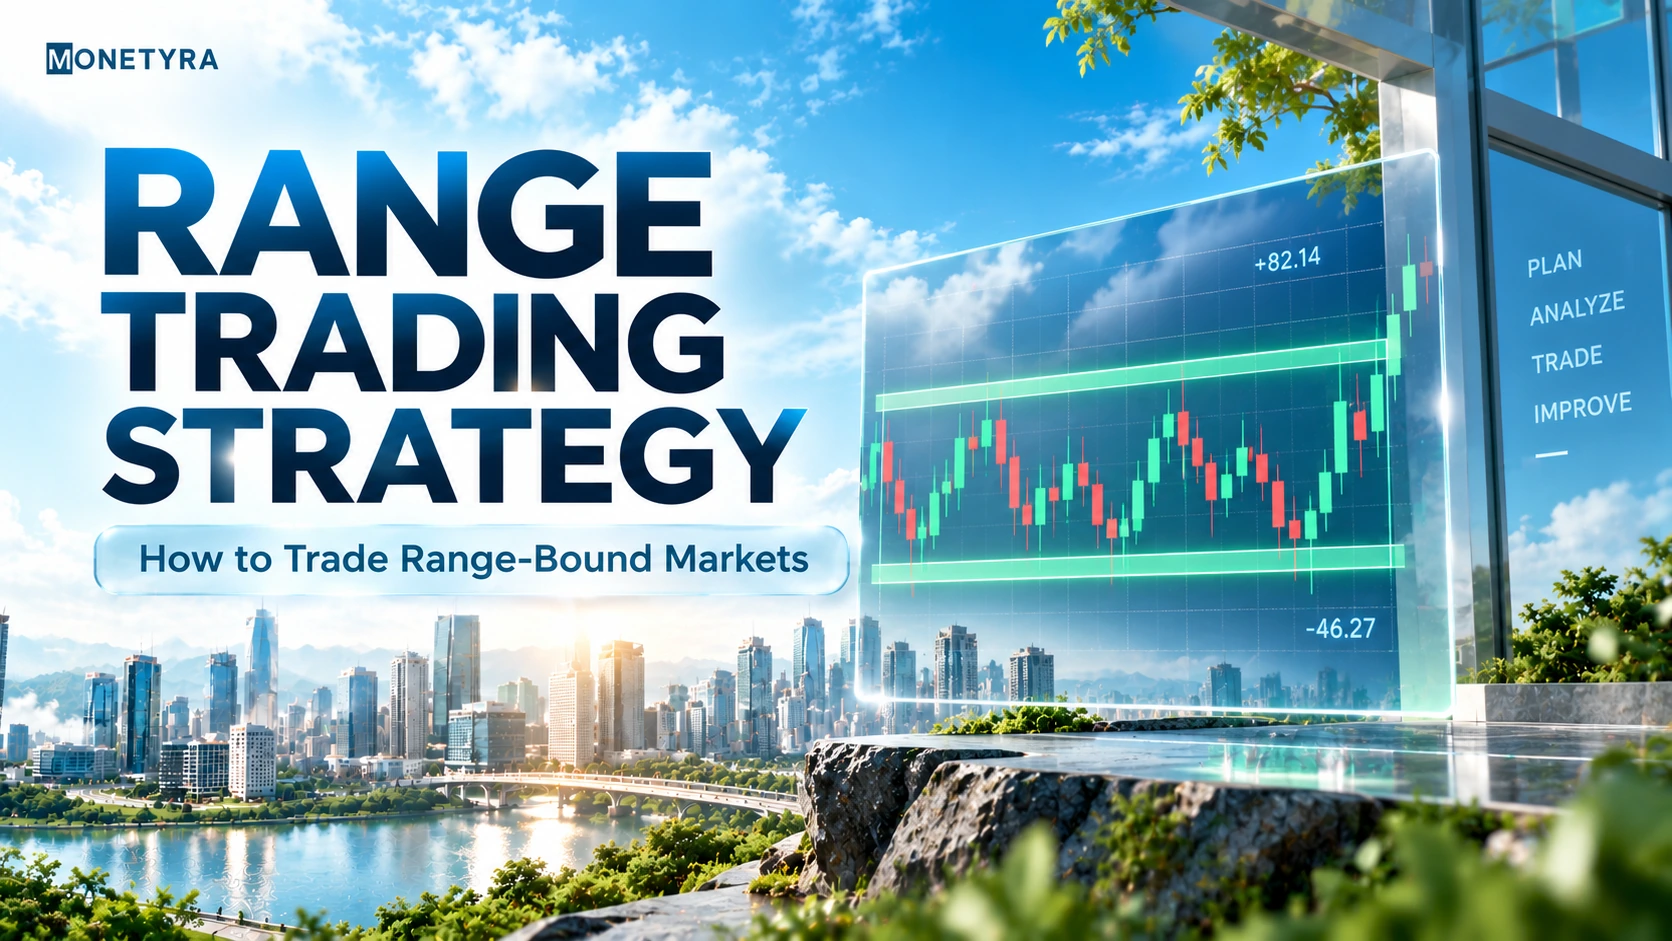
Financial markets rarely move in a single continuous line. In fact, benchmark indices and individual equities frequently spend extended periods moving sideways rather than establishing strong directional trends. When price action remains trapped between defined upper and lower levels, trend-following frameworks often trigger repeated false signals.
A range trading strategy enables traders to identify horizontal price channels, navigate sideways consolidation, and execute disciplined trades near channel boundaries while maintaining strict risk controls.
Quick Takeaways
- Range trading focuses on buying near support boundaries and selling near resistance boundaries during market consolidation.
- Identifying a valid price channel requires at least two confirmed swing highs at resistance and two swing lows at support.
- A sudden breakout beyond range boundaries poses the primary operational risk, requiring explicit stop-loss orders placed outside the channel.
What Is a Range Trading Strategy?
A range trading strategy is a technical market framework that identifies established support and resistance boundaries to execute trades within a horizontal price channel.
Range Trade Setup:
Buy Entry = Near Channel Support Boundary
Sell/Short Entry = Near Channel Resistance Boundary
Profit Target = Opposite Channel Boundary or Midpoint (50% Reversion)
This strategy operates on the core mechanical foundation of mean reversion—the market principle where asset prices fluctuate around a central equilibrium or moving average during non-trending phases. Instead of chasing momentum, you buy when price approaches lower support levels (oversold territory) and short or exit when price reaches upper resistance levels (overbought territory).
Range Trading vs Trend Trading: Key Differences
Understanding range trading vs trend trading comes down to recognizing the prevailing market structure and selecting the appropriate execution logic.
- Market Focus: Trend trading seeks directional momentum (higher highs or lower lows), whereas range trading targets horizontal consolidation (equal highs and equal lows).
- Indicator Utilization: Trend strategies deploy moving averages to ride momentum, while range strategies utilize momentum oscillators to catch turning points near boundaries.
- Risk Profile: Trend setups rely on wider trailing stops to capture large moves, whereas range setups use tight protective stops placed just outside fixed boundary zones.
| Feature | Range Trading Strategy | Trend Trading Strategy |
|---|---|---|
| Market Structure | Horizontal Consolidation (Sideways) | Directional Expansion (Up/Down) |
| Primary Entry Zone | Channel Support / Resistance | Breakouts / Pullbacks to Moving Averages |
| Indicator Tool | Oscillators (RSI, Stochastic, CCI) | Trend Filters (Moving Averages, ADX) |
| Risk-Reward Profile | Fixed Targets / High Win-Rate Potential | Variable Targets / Asymmetric Payoffs |
| Primary Threat | Structural Channel Breakout | Choppy Consolidation / Sudden Reversals |
How to Identify a Range-Bound Market
Learning how to identify range bound market conditions requires structural validation on a price chart before placing any orders.
- Confirm Boundary Points: A valid horizontal range requires a minimum of two distinct swing highs touching a horizontal resistance zone and two distinct swing lows touching a horizontal support zone.
- Evaluate Volume Dynamics: Volume typically contracts inside an established channel, reflecting reduced participation before expanding rapidly during an eventual breakout.
- Identify Moving Average Flattening: Key moving averages (such as the 20-period or 50-period SMA) flatten out horizontally and weave through the middle of price candles rather than sloping up or down.
Tip: Draw horizontal support and resistance zones as price bands rather than single thin lines to account for minor intraday spikes.
Range Trade Example: Worked P&L Scenario
To see the mechanics play out, consider a fictional large-cap stock trading within a defined range between ₹950 (support) and ₹1,050 (resistance).
- Long Entry: Price touches ₹950 with a bullish rejection candle and oversold RSI. You buy 100 shares at ₹950.
- Stop-Loss: Placed at ₹935, just below support plus an Average True Range (ATR) buffer.
- Target 1: ₹1,000 (channel midpoint) — you book 50 shares here.
- Target 2: ₹1,045, just below resistance — you exit the remaining 50 shares.
Gross Profit: (50 × ₹50) + (50 × ₹95) = ₹2,500 + ₹4,750 = ₹7,250
Now consider the same setup failing: price breaks below support to ₹935, triggering your stop-loss on the full 100 shares.
Gross Loss: 100 × (₹950 − ₹935) = ₹1,500
This asymmetry — a small, defined loss against a larger structured gain — is the core objective of disciplined range trading execution.
Real Trading Costs of Range Trading
Range trading strategies typically produce a higher frequency of trades than trend-following approaches, which means transaction costs compound faster and can quietly erode your edge.
- Brokerage: Charged on every entry and exit — with partial profit booking at two targets, that’s effectively three to four chargeable legs per trade cycle.
- Securities Transaction Tax (STT): Applies on the sell side for cash equity range trades.
- Goods and Services Tax (GST): 18% on brokerage and exchange transaction charges combined.
- Slippage: Range boundaries are watched by many traders simultaneously, so fills near support/resistance can occur at slightly worse prices than intended.
Tip: Because range trading often targets smaller price swings, always confirm your profit target comfortably exceeds your total round-trip costs before entering — otherwise a “winning” trade can still net negative.
Best Indicators for Range Trading
Using technical indicators helps confirm reversal signals at channel boundaries. The best indicator for range trading environments combines momentum detection with volatility bands:
- Relative Strength Index (RSI): Measures price speed and change. Readings above 70 near channel resistance signal overbought conditions, while readings below 30 near channel support signal oversold conditions.
- Stochastic Oscillator: Tracks closing prices relative to high-low ranges. Signal line crossovers below 20 at support provide long triggers, while crossovers above 80 at resistance provide short triggers.
- Average Directional Index (ADX): Functions as a trend-strength filter. An ADX reading below 20–25 confirms that directional trend strength is weak, indicating ideal range conditions.
- Bollinger Bands: Provide dynamic upper and lower boundaries. Outer bands contract during low volatility, acting as flexible support and resistance barriers.
How to Trade a Range-Bound Market: Step-by-Step Execution
Executing a structured channel trade requires entering near boundary edges, placing protective stops outside the channel, and locking in profits systematically.
- Step 1 (Setup): Identify clear horizontal support and resistance levels on your preferred execution timeframe.
- Step 2 (Trigger): Wait for price to touch a boundary zone and form a rejection candlestick pattern (such as a pin bar or engulfing candle).
- Step 3 (Confirmation): Verify that your chosen momentum oscillator (e.g., RSI or Stochastic) shows an overbought/oversold turning point.
- Step 4 (Stop-Loss): Place a protective stop-loss order slightly beyond the range boundary plus an Average True Range (ATR) buffer.
- Step 5 (Take-Profit): Set your initial profit target at the mid-channel line (50% mark) and your final target near the opposite boundary zone.
| Trade Parameter | Long Setup (Buy Boundary) | Short Setup (Sell Boundary) |
|---|---|---|
| Entry Trigger | Rejection at Support + Oversold RSI | Rejection at Resistance + Overbought RSI |
| Stop-Loss Location | Below Support Level − ATR Buffer | Above Resistance Level + ATR Buffer |
| Target 1 (Partial) | Channel Midpoint (50% Mean) | Channel Midpoint (50% Mean) |
| Target 2 (Final) | Just Below Resistance Zone | Just Above Support Zone |
Risk Management: Handling False Breakouts
The fundamental risk in range trading is a structural breakout, where market volume expands and price leaves the channel permanently.
- Beware Liquidity Sweeps: Institutional orders frequently sweep past horizontal support or resistance to collect stop-loss liquidity before price reverses back inside the range.
- Use Candle Closes for Validation: Always wait for a timeframe candle to close before confirming whether a move is a false breakout or a genuine channel exit.
- Respect Volatility Expansion: Avoid taking range entries immediately prior to major economic releases, interest rate announcements, or quarterly earnings reports, as volatility spikes routinely shatter established boundaries.
Warning: Attempting to hold a losing range position when price breaks cleanly past your boundary is a common cause of steep drawdown. Always execute protective stop-loss orders.
Position Sizing and Risk-Reward Ratio in Range Trading
A structural advantage of range trading is that your stop-loss and target levels are known before you enter, allowing you to calculate your risk-reward ratio in advance rather than estimating it on the fly.
Risk-Reward Ratio = (Entry Price − Stop-Loss Price) : (Target Price − Entry Price)
Range setups typically aim for a minimum 1:1.5 to 1:2 risk-reward ratio, since the fixed-boundary nature of the strategy can potentially offer a higher win rate compared to breakout or trend trades, though actual outcomes will vary depending on market conditions and execution discipline.
Tip: Size your position so that a stop-loss hit never risks more than 1–2% of your total trading capital — this keeps a single failed range breakout from causing significant account drawdown.
Range Trading in Indian Markets
Applying range concepts to Indian equities and derivatives requires aligning setups with exchange mechanics and domestic market volatility.
- Asset Selection: Focus on liquid large-cap equities on the National Stock Exchange (NSE) or major index options (such as Nifty 50 and Bank Nifty) during non-trending consolidation phases.
- Session Dynamics: The initial market opening window (9:15 AM to 9:45 AM Indian Standard Time (IST)) often experiences opening volatility spikes. Range boundaries typically settle between 10:00 AM and 2:30 PM IST before late-session square-offs.
- Taxation Considerations: Short-term equity trading gains are subject to Short-Term Capital Gains (STCG) tax under Indian tax regulations, while intraday equity profits are classified as speculative business income taxed at applicable slab rates.
Range Trading Using Options
Beyond buying and shorting the underlying stock at channel boundaries, experienced traders in the Indian Futures & Options (F&O) segment often express a range-bound view directly through options strategies, which profit from time decay rather than directional price movement.
- Short Strangle: Selling an out-of-the-money Call above resistance and an out-of-the-money Put below support simultaneously. The position profits if the underlying stays within the range through expiry, but carries unlimited risk if price breaks out sharply in either direction.
- Iron Condor: A more defined-risk variation of the short strangle, built by also buying a further out-of-the-money Call and Put to cap potential losses on either side.
Warning: Both strategies rely on the range holding until expiry — a strong breakout can result in losses that exceed the initial premium collected, particularly with an uncapped short strangle. These strategies also require margin approval and are best suited to traders already comfortable with options mechanics.
Conclusion
A well-defined range trading strategy provides a clear framework for navigating sideways market consolidation. By identifying structural price channels, confirming entries with momentum indicators, and applying strict protective stop-loss rules outside boundaries, you can maintain consistency while managing breakout risk.
Mastering price action and indicators helps you make informed entry and exit decisions.
FAQs
A range trading strategy is a technical approach where you identify horizontal support and resistance levels, buying near the lower support boundary and shorting or selling near the upper resistance boundary during sideways consolidation.
You can identify a range-bound market by locating at least two swing highs that form a horizontal resistance line and two swing lows that form a horizontal support line, alongside flattening moving averages.
Momentum oscillators such as the Relative Strength Index (RSI) and the Stochastic Oscillator are widely considered effective indicators for range trading because they highlight overbought and oversold turning points.
Range trading focuses on buying low and selling high within a non-trending horizontal channel, while trend trading focuses on capturing sustained momentum in a single upward or downward direction.
Stop-loss orders in range trading should be placed just beyond the outer edge of the support or resistance boundary zone, with an Average True Range (ATR) buffer to avoid being stopped out by minor volatility spikes.
Intraday traders on the NSE frequently use 5-minute to 15-minute charts to trade intraday ranges, while swing traders utilize 1-hour to Daily charts to capture multi-day consolidation patterns.
Disclaimer: This article was written with the help of AI and reviewed by the Monetyra editorial team. It is for educational purposes only and should not be considered financial advice. Trading and investing in financial instruments involve significant risk of loss and are not suitable for all investors, and past performance of any strategy does not guarantee future results. Please consult a licensed financial advisor before making any investment or trading decision.
In India, regulatory oversight of securities markets is conducted by the Securities and Exchange Board of India (SEBI). Readers are advised to verify the regulatory status of their broker/fund house and ensure compliance with applicable Indian laws before investing.