Option Chain Meaning: A Simple Guide for Beginners
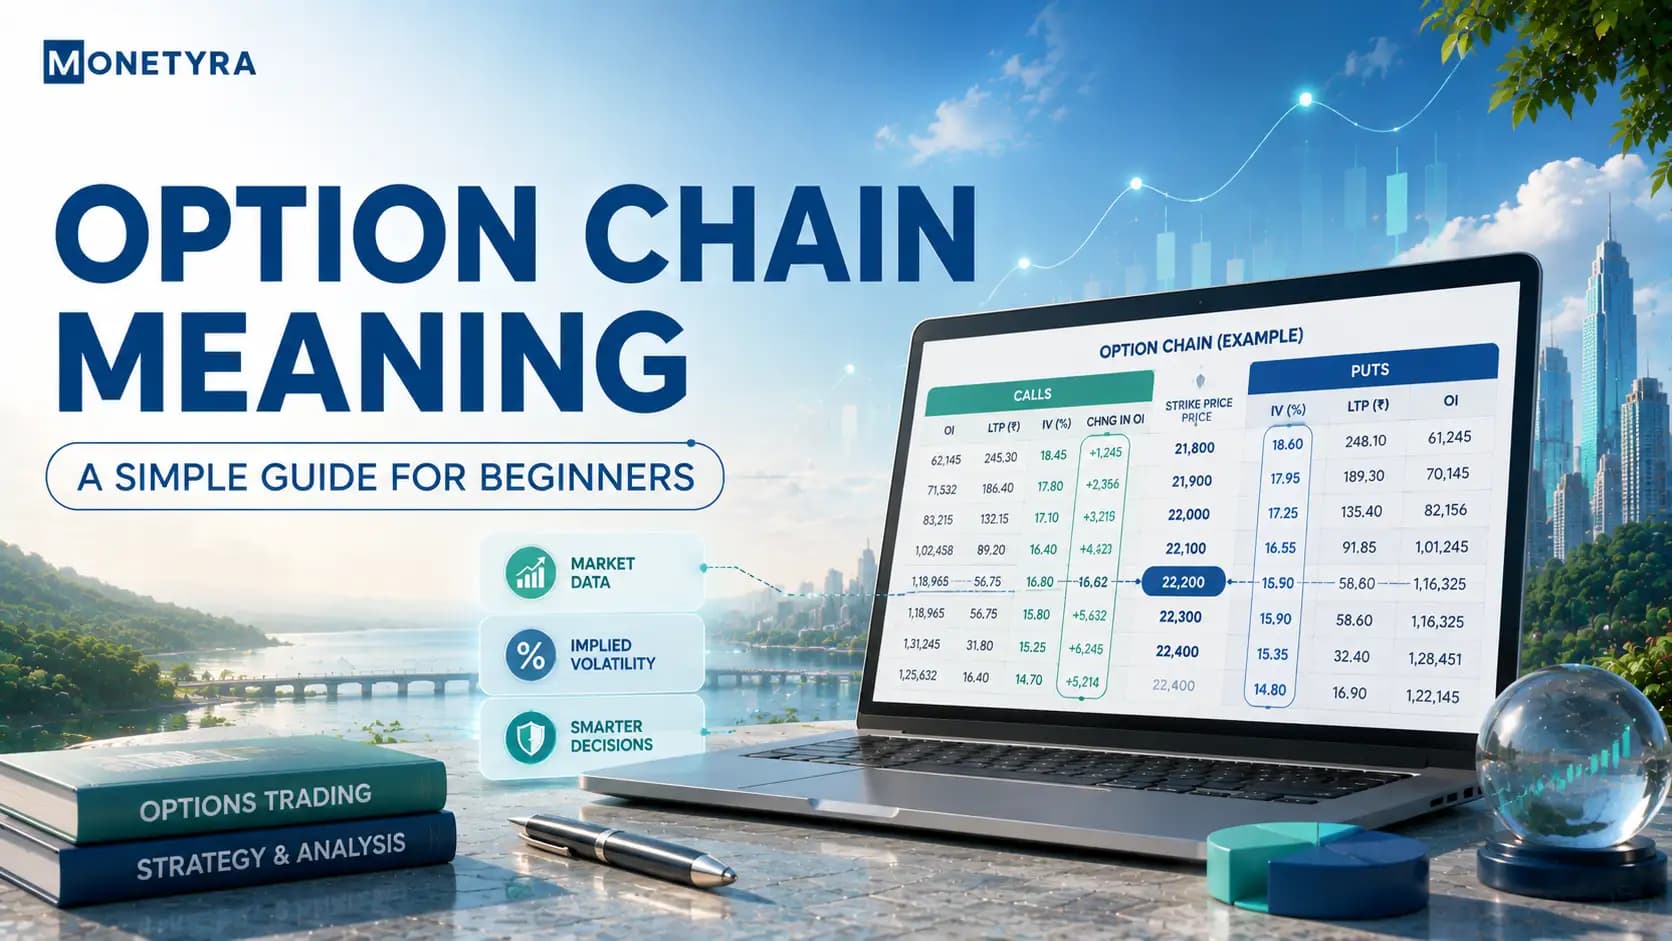
An option chain is a real-time matrix that displays all active call and put option contracts for a stock or market index in a single centralized table. Think of it as a live menu for options trading: it lists every available strike price alongside its current market premium, trading volume, and open interest. For traders looking beyond basic price charts, learning how to read an option chain provides key insights into market sentiment, price levels, and institutional activity.
Quick Takeaways
- An option chain is a structured table that lists all active call and put option contracts available for a specific stock or market index.
- It displays key trading metrics, including strike prices, market prices, trading volume, and open interest.
- Option chain data shifts continuously with market moves, so reading a single static snapshot without tracking broader market context can lead to misleading conclusions.
What Is Option Chain Meaning?
An option chain is a comprehensive, real-time matrix that displays all available option contracts—both call options and put options—for a specific underlying asset across various strike prices and expiration dates.
Think of an option chain as a live restaurant menu. Instead of listing dishes and prices, it lists every target price (strike price) at which you can buy or sell an asset, along with the current cost (premium) of that specific contract.
For Indian retail traders, checking the National Stock Exchange (NSE) option chain is a standard daily routine. Whether you trade individual stock options or major market indices like Nifty 50 and Bank Nifty, the option chain compiles all open market bids and offers into a single centralized table.
Key Terms: CE, PE, and Strike Price
When you open an option chain matrix for the first time, the volume of numbers can feel overwhelming. However, the entire table is organized around three primary anchor points.
| Call Options (CE) | Strike Price | Put Options (PE) |
|---|---|---|
| Bullish Positions | Target Price | Bearish Positions |
CE and PE (Call & Put)
In the Indian stock market, option contracts are categorized into two types:
- CE (Call Option / Call European): Displayed on the left side of the NSE option chain. Buyers of call options generally expect the price of the underlying asset to rise.
- PE (Put Option / Put European): Displayed on the right side of the NSE option chain. Buyers of put options generally expect the price of the underlying asset to fall.
Strike Price
The strike price sits prominently in the center column of the option chain. It represents the fixed price at which the option contract can be exercised upon expiration, regardless of where the market price moves.
Understanding Moneyness: ITM, ATM, and OTM
The relationship between the current spot market price of a stock and the strike price determines its “moneyness”. On the official NSE website, these categories are visually highlighted using shaded and unshaded regions.
| Moneyness Category | Call Options (CE) Condition | Put Options (PE) Condition | Visual Appearance on NSE Table |
|---|---|---|---|
| In-The-Money (ITM) | Strike Price < Spot Price | Strike Price > Spot Price | Shaded Background |
| At-The-Money (ATM) | Strike Price ≈ Spot Price | Strike Price ≈ Spot Price | Unshaded / Boundary Strike |
| Out-Of-The-Money (OTM) | Strike Price > Spot Price | Strike Price < Spot Price | Unshaded Background |
In-The-Money (ITM): Contracts that possess intrinsic, tangible value. On the NSE option chain, ITM calls are shaded yellow/grey on the left, while ITM puts are shaded on the right.- At-The-Money (ATM): The strike price closest to the current market spot price.
- Out-Of-The-Money (OTM): Contracts containing zero intrinsic value, consisting entirely of time value. These sit in the unshaded rows of the matrix.

Tips: Options with OTM strike prices carry lower premiums, but they carry a high risk of expiring completely worthless at maturity.
What Is Open Interest (OI) and Volume?
Beyond pricing, an option chain provides critical institutional market data through open interest and volume metrics.
Open Interest (OI)
Open interest measures the total number of outstanding, active option contracts that have been opened but not yet settled, exercised, or closed out by market participants.
- High OI Concentration: Large accumulations of open interest at specific strike prices often indicate potential market support or resistance levels, as option writers (sellers) defend these price points.
- Change in OI: Tracking the single-day net increase or decrease in open interest helps reveal whether institutional capital is building up or unwinding positions.
Volume
While OI represents open positions held overnight, volume reflects total activity within the current trading day. High trading volume combined with rising open interest indicates active institutional participation.
Implied Volatility (IV)
The option chain table also displays Implied Volatility (IV) for each strike price. IV measures the market’s forward-looking estimate of price volatility. Higher IV expands option premiums, whereas declining IV causes option prices to shrink.
How to Read the NSE Option Chain
To view live market data directly from the official exchange source, follow these steps:
- Navigate to the official National Stock Exchange (NSE) website.
- Select Option Chain under the Market Data menu.
- Choose your desired symbol (e.g., Nifty, Bank Nifty, or a specific stock) and the target expiry date.
- Locate the central Strike Price column and identify the current spot price row.
- Analyze the OI and Change in OI columns on both the Call (left) and Put (right) sides to gauge market positioning.
Warning: Option chain data shifts dynamically during market hours. Relying solely on static OI numbers without monitoring live price action can lead to false signals, and trading options carries a significant risk of total capital loss.
Conclusion
Understanding the option chain meaning allows you to move beyond basic price charts and view underlying market activity, contract values, and open institutional interest. By learning to read strike prices, call and put data, open interest, and moneyness, retail traders gain a clearer view of how market participants position themselves across different price levels.
Learn options fundamentals and trading concepts built for Indian retail markets.
FAQs
An option chain is a detailed matrix listing all active option contracts—including call and put options, strike prices, premiums, and open interest—available for a specific stock or index.
In an option chain, CE stands for Call European (Call Option), located on the left side, while PE stands for Put European (Put Option), located on the right side.
Open interest (OI) represents the total number of outstanding option contracts that are currently open and held by market participants for a specific strike price.
Beginners should start by locating the center Strike Price column, matching it with the asset’s current spot price, and comparing Call (left) vs Put (right) open interest and premium values.
Traders analyze option chain data by tracking high concentrations of open interest to identify potential support and resistance zones, alongside changes in trading volume and implied volatility.
Disclaimer: This article was written with the help of AI and reviewed by the Monetyra editorial team. It is for educational purposes only and should not be considered financial advice. Trading and investing in financial instruments involve significant risk of loss and are not suitable for all investors, and past performance of any strategy does not guarantee future results. Please consult a licensed financial advisor before making any investment or trading decision.
In India, options trading is regulated by the Securities and Exchange Board of India (SEBI). Readers are advised to verify the regulatory status of their broker and ensure compliance with applicable Indian laws before investing.