Gravestone Doji Candlestick Pattern: Meaning And Setup
A sudden surge in buying volume during an active uptrend can often look like a clear breakout, but when that momentum collapses before the session close, it leaves behind a distinct price footprint.
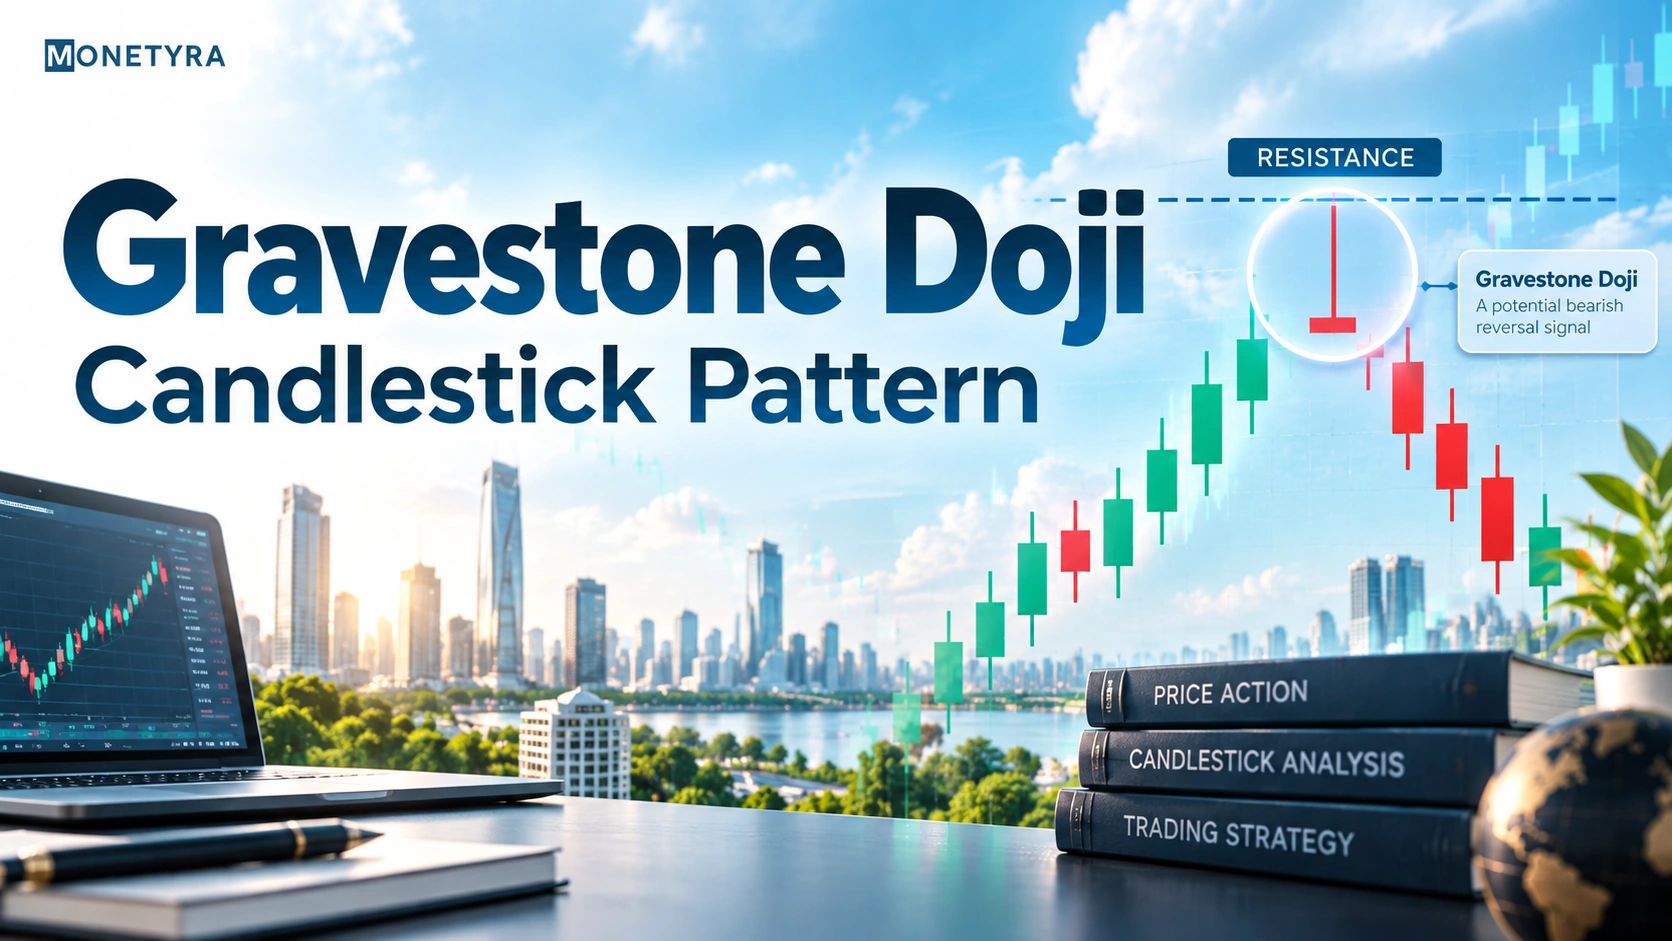
The gravestone doji candlestick pattern is a single-candle structure defined by an elongated upper shadow and an open, low, and close that converge at or near the bottom of the session range. It reflects a complete intra-session reversal where buyers push prices higher, only to be overwhelmed by aggressive selling pressure before the market closes.
Quick Takeaways
- The gravestone doji candlestick pattern features a long upper wick with virtually no lower shadow, signaling severe buyer exhaustion near market highs.
- Confirmation requires the subsequent candle to close below the Doji low before taking an entry short position.
- High intraday volatility can trigger false breakouts, making strict stop-loss placement mandatory directly above the upper shadow tip.
What Is the Gravestone Doji Candlestick Pattern?

The gravestone doji candlestick pattern is a single-candle price formation where the open, low, and close prices are virtually identical and located at the absolute bottom of the session’s trading range. This unique shape creates a visually striking structure: a tall upper shadow (or wick) with little to no real body and no lower shadow.
In terms of market mechanics, understanding the gravestone doji meaning requires analyzing the intra-session tug-of-war between buyers and sellers. When the candle opens, aggressive buyers drive the price upward to create the high of the session. However, as the price reaches higher levels, supply floods the market or buyers run out of capital. Sellers step in forcefully, pushing the price all the way back down to close near the session’s opening level.
As part of the broader doji candlestick pattern family—which includes standard Dojis, Long-Legged Dojis, and Dragonfly Dojis—the Gravestone Doji highlights severe indecision that quickly resolves in favor of supply over demand.
Tip: Look for an upper shadow length that is at least two to three times larger than the average candle body of the preceding swing to ensure the rejection carries real technical weight.
How to Identify a Gravestone Doji on a Chart
Identifying a true Gravestone Doji requires verifying three main anatomical traits:
- Minimal to Zero Real Body: The open and close prices must sit within 0.1% of each other.
- Extended Upper Shadow: The upper wick should dominate the candle, ideally measuring greater than 1.5 times the 14-period Average True Range (ATR) to filter out market noise.
- Absent Lower Shadow: The low price should be identical—or extremely close—to the open and close prices.
You might confuse the Gravestone Doji with other single-candle reversal formations, such as the shooting star candlestick pattern or the hanging man candlestick pattern. While all three signal selling pressure, their anatomical structures differ:
| Pattern Name | Open/Close Location | Upper Shadow | Lower Shadow | Primary Implication |
|---|---|---|---|---|
| Gravestone Doji | At the session Low | Long (≥ 70% of total range) | Virtually non-existent | Bearish Reversal |
| Shooting Star | Near the session Low (Small Body) | Long (≥ 2x body size) | Minimal | Bearish Reversal |
| Hanging Man | Near the session High (Small Body) | Minimal | Long (≥ 2x body size) | Bearish Warning |
Gravestone Doji vs Dragonfly Doji: Key Differences
When you evaluate gravestone doji vs dragonfly doji, you’re looking at exact structural opposites. While both patterns feature virtually identical open and close prices with almost no real body, their shadow orientations reflect inverted market dynamics.
| Feature | Gravestone Doji | Dragonfly Doji |
|---|---|---|
| Shadow Location | Long Upper Shadow | Long Lower Shadow |
| Price Rejection | Rejection of Higher Prices | Rejection of Lower Prices |
| Intraday Control | Sellers crush early buying rally | Buyers recover from early sell-off |
| Market Context | Top of an uptrend / Resistance | Bottom of a downtrend / Support |
| Bias | Bearish Reversal | Bullish Reversal |
The Dragonfly Doji shows that sellers tried to push prices down during the session, but buyers surged in to drive the price back up to the open. Conversely, the Gravestone Doji reveals that buyers tried to drive the price up, but sellers completely took control by the close.
How Rare Is the Gravestone Doji Pattern?
Addressing the common question: how rare is gravestone doji? A perfect, tick-level Gravestone Doji—where the open, low, and close match to the exact decimal—is relatively rare in liquid equity and derivative markets.
Because institutional order flow and retail market orders create continuous price micro-fluctuations, exact Doji candles occur infrequently on daily charts. However, near-Doji variations (where the real body accounts for less than 5% to 10% of the total candle height) appear regularly across different timeframes.
- Intraday Timeframes (5m / 15m): Occur frequently during market opens or high-impact news releases, though they carry a higher rate of false signals.
- Daily / Weekly Timeframes: Far less frequent, but they carry significantly higher statistical reliability when found on major index charts like the Nifty 50 or Bank Nifty.
How to Trade the Gravestone Doji: Step-by-Step
Trading the Gravestone Doji effectively requires patience and strict adherence to systematic confirmation rules.
Step 1: Context Verification
Confirm that the asset is currently in an uptrend or approaching a high-probability supply zone, such as a previous swing high or a daily pivot level.
Step 2: Pattern Validation
Ensure the candle meets all visual criteria: a long upper wick, no lower shadow, and an open/close near the absolute bottom of the candle range.
Step 3: Wait for Confirmation
Do not enter a trade on the Doji candle itself. Wait for the subsequent candle (the confirmation candle) to close below the low of the Gravestone Doji.
Step 4: Define Execution Parameters
Calculate your entry, stop-loss, and profit targets using structured formulas:
| Parameter | Execution Rule / Location | Operational Formula |
|---|---|---|
| Entry Point | Market Short / Sell Stop | Break/Close below the Doji Low |
| Stop-Loss (SL) | 1-2 Ticks above the High | Doji High + (0.1 × ATR) |
| Take-Profit (TP) | Key Support Level | Minimum 1:2 Risk-to-Reward Ratio |
Warning: Entering a position before the confirmation candle closes exposes your account to sudden short-squeeze reversals if buyers re-enter the market.
Common Mistakes When Trading the Gravestone Doji
Even clear candlestick setups can fail if executed without discipline. Avoid these frequent execution errors:
- Anticipating the Close: Opening a short position while the Doji candle is still forming. Intraday price action can quickly change, turning a temporary Gravestone Doji into a strong bullish Marubozu before the session closes.
- Ignoring Surrounding Volume: A valid Gravestone Doji should ideally show above-average trading volume during the upper-wick rejection, indicating genuine institutional distribution.
- Trading in Strong Momentum: Attempting to short a Gravestone Doji that forms in the middle of a powerful parabolic uptrend without additional technical confluence.
Trading Gravestone Doji in Indian Markets
When trading the Gravestone Doji across Indian equity and derivative markets, local volatility drivers must be integrated into your trade plan:
- Market Opening Volatility (09:15 IST): Early morning price action on the National Stock Exchange (NSE) often generates long wicks due to overnight gap adjustments. Avoid treating early 5-minute Dojis as true structural reversals.
- European Session Overlap (13:30 IST): Volume shifts noticeably around mid-afternoon in India as European markets open. Gravestone Dojis forming near major resistance zones during this window on Bank Nifty or Nifty 50 futures often carry stronger institutional backing.
- Derivative Expiry Dynamics: On weekly options expiry days, sharp gamma spikes can create artificial upper-wick rejections that reverse rapidly. Always use buffer offsets on your stop-loss calculations when trading high-beta Indian equities.
Conclusion
The gravestone doji candlestick pattern gives you a clear visual representation of intra-session buyer exhaustion and emerging supply. By signaling a sharp shift from bullish enthusiasm to bearish control, it highlights prime short-execution setups near key resistance levels. However, because market noise can create fake rejections, combining this setup with confirmation closes, volume validation, and strict stop-loss rules is essential for consistent risk management.
Mastering price action requires understanding how market structure and market psychology intersect on the chart.
FAQs
Exact tick-level Gravestone Dojis are rare on daily stock charts because price micro-fluctuations usually create small real bodies. However, near-Doji variations with tiny bodies and long upper wicks appear regularly across liquid markets.
While the structure itself represents selling pressure, a Gravestone Doji at the bottom of a downtrend is usually considered a trend continuation signal or market indecision, rather than a reliable bullish reversal signal.
The Gravestone Doji features a long upper shadow, signaling rejection at higher prices and a bearish bias. The Dragonfly Doji features a long lower shadow, signaling rejection at lower prices and a bullish bias.
A Gravestone Doji accompanied by high trading volume indicates significant institutional selling or profit-taking at higher levels, giving stronger technical weight to the potential bearish reversal.
Place your stop-loss slightly above the highest point of the Doji’s upper shadow. Adding a small volatility buffer based on the Average True Range (ATR) helps avoid getting stopped out by false spikes.
Yes, candlestick patterns are probabilistic setups, not guarantees. A Gravestone Doji can fail if strong institutional buying returns, which is why waiting for confirmation and using a protective stop-loss is mandatory.
Disclaimer: This article was written with the help of AI and reviewed by the Monetyra editorial team. It is for educational purposes only and should not be considered financial advice. Trading and investing in financial instruments involve significant risk of loss and are not suitable for all investors, and past performance of any strategy does not guarantee future results. Please consult a licensed financial advisor before making any investment or trading decision.
In India, regulatory oversight is governed by Securities and Exchange Board of India (SEBI). Readers are advised to verify the regulatory status of their broker/fund house and ensure compliance with applicable Indian laws before investing.