Risk of Ruin Calculator: Meaning, Formula & Rules
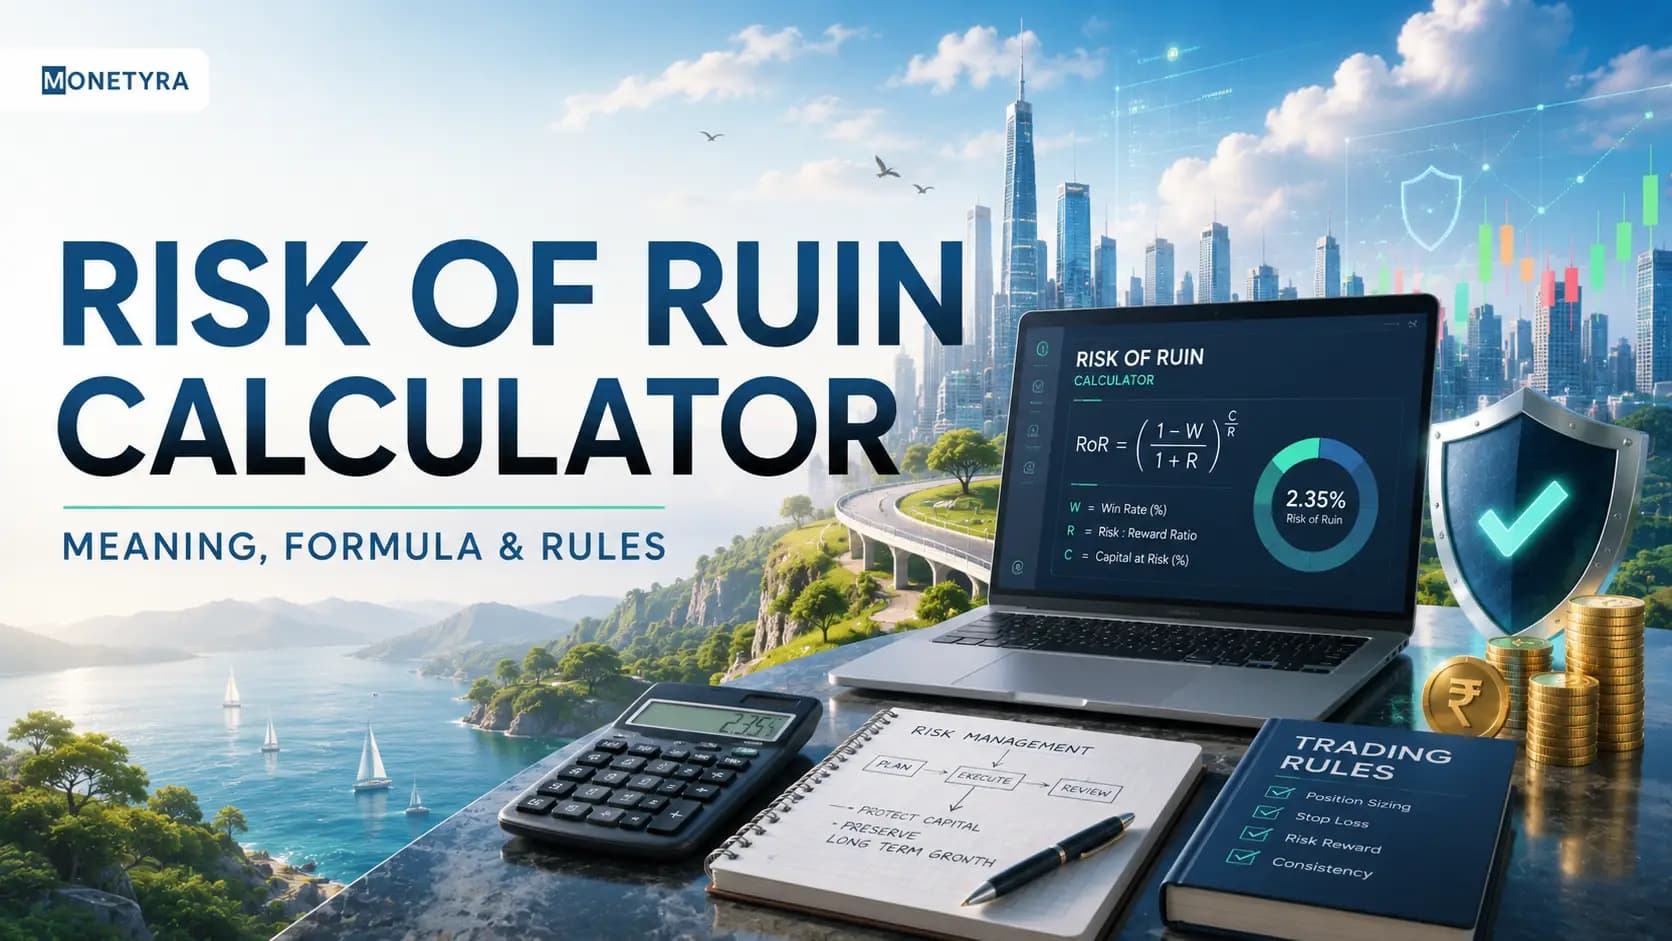
Imagine a deep-sea diver preparing for an underwater expedition. Carrying a high-end underwater camera and expert navigation gear is valuable, but if the diver runs out of oxygen before returning to the surface, the dive ends in catastrophe.
In active market trading, capital is your oxygen supply. No matter how advanced your technical indicators or charting tools are, running out of capital halts your trading permanently.
This calculator acts as your financial air gauge. Supervised under retail risk guidelines set by the Securities and Exchange Board of India (SEBI) and market trading frameworks on the National Stock Exchange (NSE), evaluating your probability of ruin ensures your trading account can withstand unavoidable losing streaks without facing total capital depletion.
Quick Takeaways
- Core Definition: A risk of ruin calculator is a quantitative risk management tool used to estimate the statistical probability of a trading account suffering complete financial loss.
- Primary Mechanism: Operates by analyzing three core variables: historical win rate percentage, average risk-to-reward ratio (RRR), and the percentage of total equity risked per trade.
- Primary Limit: While the calculator provides an essential mathematical probability baseline, it assumes static performance metrics and cannot account for real-world slippage or panic trading execution errors.
What Is a Risk of Ruin Calculator?
A risk of ruin calculator is a statistical risk modeling tool that calculates the mathematical probability of a trading account incurring a drawdown so severe that recovery becomes mathematically impossible.
Understanding how this tool works helps active traders evaluate whether their position sizing strategy is sustainable over long sample sizes. Unlike simple historical drawdowns, probability of ruin modeling combines your strategy’s win rate with trade-level position risk to project long-term capital safety. Combining probability tools with sound Capital Preservation strategies helps prevent account blowouts during severe market drawdowns.
- Statistical Edge Verification: Determines whether a trading strategy can survive a series of consecutive losses.
- Objective Position Sizing: Replaces guesswork by showing exactly how risking higher account percentages increases the mathematical likelihood of total loss.
Tips: Aim to keep your statistical risk of ruin at 0% by capping your account risk per trade strictly below 2%.
The Risk of Ruin Formula & Sizing Math
Understanding the mathematical inputs behind a risk of ruin calculator allows traders to optimize their position sizing for capital longevity.
The core inputs used in risk of ruin calculations include:
- Win Rate Percentage: The proportion of total trades that close with a profit.
- Risk-to-Reward Ratio (RRR): The average profit size relative to average loss size per trade.
- Risk Per Trade (%): The percentage of total trading account equity risked on a single order.
When a trader risks a high percentage of capital per trade, the mathematical probability of facing account exhaustion increases exponentially, even if the trading strategy boasts a high win rate. Practicing systematic Position Sizing in Trading keeps trade risk small relative to total account equity.
Warning: Risking more than 5% of your account per trade causes the risk of ruin curve to spike sharply, making an account blowout mathematically probable during inevitable losing streaks.
Risk of Ruin vs Maximum Drawdown
Traders often confuse peak-to-trough account pullbacks with statistical ruin.
- Maximum Drawdown: Measures the largest historic peak-to-trough drop in account value over a specific trading period. It represents real historical performance.
- Risk of Ruin: Measures the forward-looking probability that account equity will hit a designated point of financial collapse (such as a 50% or 100% loss).
Reviewing historical drawdown metrics alongside your Maximum Drawdown limits ensures your trading plan remains statistically viable.
| Risk per Trade (%) | Win Rate (%) | Risk-to-Reward (RRR) | Ruin Probability (%) | Risk Assessment |
|---|---|---|---|---|
| 1.0% | 50% | 1:2 | ~0.0% | Exceptionally Safe |
| 2.0% | 50% | 1:2 | ~0.2% | Conservative & Safe |
| 5.0% | 50% | 1:2 | ~13.5% | High Risk |
| 10.0% | 50% | 1:2 | ~48.0% | Extreme Danger |
Managing Ruin Risk Under SEBI Rules in India
Indian retail traders navigating SEBI peak margin rules across intraday equities or NSE derivative contracts must manage ruin risk by calculating risk per trade in exact rupee amounts.
Example Rupee Sizing Impact
Consider a trader with an account balance of ₹500,000 trading Nifty futures:
- Scenario A (5% Risk per Trade): The trader risks ₹25,000 per trade. Facing 10 consecutive losses results in a ₹250,000 loss (50% account drawdown). Recovering from a 50% drawdown requires a 100% gain just to break even, placing the account in extreme ruin danger.
- Scenario B (1% Risk per Trade): The trader risks ₹5,000 per trade. Facing 10 consecutive losses results in a ₹50,000 loss (10% account drawdown). The account remains fully operational with a near 0% statistical probability of ruin.
Overcoming Behavioral Risks & Consecutive Losses
This calculator provides theoretical mathematical safety, but real-world trading introduces behavioral challenges. During an unexpected 8-to-10 trade losing streak, traders often suffer from emotional stress, leading to revenge trading or doubling position sizes to recover losses quickly.
Deviating from your position sizing plan by increasing leverage rapidly pushes a strategy’s real probability of ruin toward 100%. Maintaining strict trade discipline is essential for long-term survival.
Master position sizing formulas, drawdown limits, and capital preservation rules.
FAQs
It is a quantitative tool that estimates the statistical probability of a trading account suffering a catastrophic drawdown or complete capital loss.
Risk of ruin is calculated using formulas that combine your strategy’s win rate, average risk-to-reward ratio, and the percentage of account equity risked per trade.
An acceptable risk of ruin percentage should be as close to 0% as possible (ideally under 1%). Anything above 5% indicates unsustainable risk exposure.
A higher win rate lowers the probability of ruin, but risking too much capital per trade can still cause account exhaustion even with a high win rate.
The mathematical formula estimates ruin probability based on win percentage (W), loss percentage (L = 1 – W), and the number of risk units in account equity.
Maximum drawdown measures historical peak-to-trough capital loss, whereas risk of ruin measures the forward-looking probability of reaching total financial collapse.
Disclaimer: This article was written with the help of AI and reviewed by the Monetyra editorial team. It is for educational purposes only and should not be considered financial or investment advice. Active trading involves significant risk of capital loss and past performance does not guarantee future results. Please consult a qualified financial advisor before trading.
In India, equity and derivatives trading are regulated by SEBI and exchange policies. Market participants must comply with margin regulations, brokerage rules, and risk disclosure norms on Indian exchanges.