What Is a Renko Chart and How Do You Set Brick Size?

Standard time-based candlestick charts in trading record every open, high, low, and close within fixed intervals, often creating jagged wicks during sideways consolidation. For intraday traders, those minor price fluctuations can trigger premature stop-outs and impulsive entries.
A renko chart eliminates the time axis completely and plots uniform bricks based solely on price movement. By filtering out small wiggles and focusing strictly on directional momentum, this price-based charting method helps you evaluate trend structure and choose between fixed or volatility-adjusted brick sizes.
Quick Takeaways
- A Renko chart constructs uniform bricks purely from predefined price movements, ignoring time intervals and compressing minor sideways fluctuations.
- Reversing brick color requires price to travel twice the brick size in the opposite direction, which filters minor noise while introducing entry lag.
- Because Renko obscures time and overnight price gaps, intraday traders on Indian exchanges face slippage risk around the 9:15 AM IST market open if orders remain unmanaged.
What Is a Renko Chart and How Does It Work?
A Renko chart is a price-based technical charting tool that plots uniform bricks whenever price moves a specified distance, ignoring time completely.
Derived from the Japanese word renga (meaning brick), this chart type removes the horizontal time axis found on standard intraday charts. A single brick might form in ten seconds during a sharp news breakout, or take three hours during a quiet afternoon session. Traders who prefer noise-filtering tools often compare Renko with Heikin Ashi charts, though Heikin Ashi still plots one candle per time interval.
Every Renko brick follows three strict construction rules:
- Bullish brick (green or white): Prints upward at a 45-degree angle when the closing price rises by at least one full brick size above the top of the previous bullish brick.
- Bearish brick (red or black): Prints downward at a 45-degree angle when the closing price falls by at least one full brick size below the bottom of the previous bearish brick.
- Reversal brick (2x rule): Requires price to move double the brick size in the opposite direction from the extreme edge of the prior brick before a new color appears.
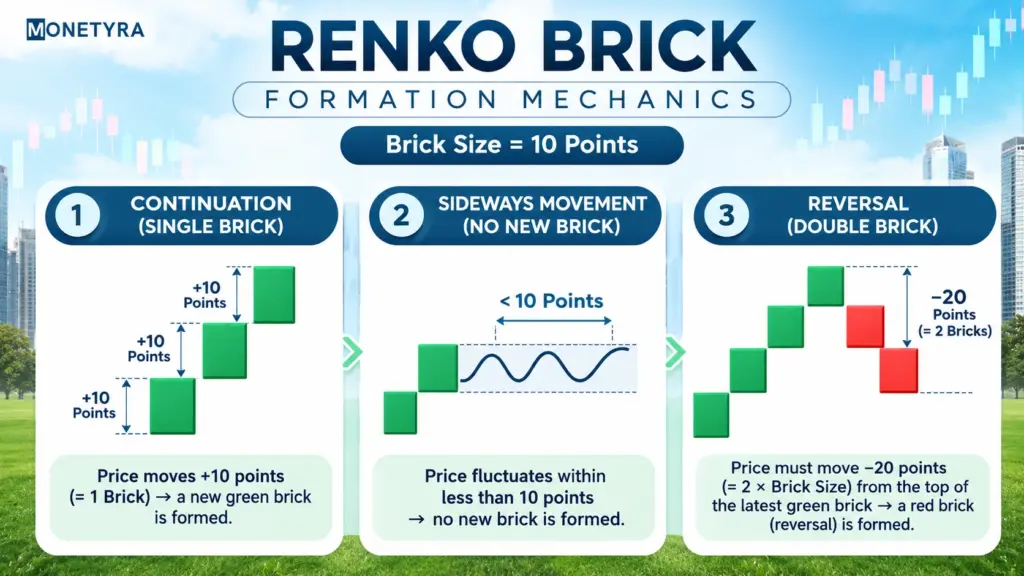
In this hypothetical example, suppose you set a 10-point brick size and a bullish green brick closes at 24,000. Price must reach 24,010 or higher to print the next green brick. If price only fluctuates between 23,985 and 24,008, the chart remains completely static. To print the first bearish red brick, price must fall 20 points from the 24,000 top down to 23,980.
How to Calculate and Set Renko Brick Size: ATR vs. Fixed Box
Selecting the brick threshold determines how sensitive your chart is to price swings. A brick size that is too small reintroduces market noise, while an oversized brick delays signals until a large portion of the move has already occurred.
Traders generally configure brick sizes using one of two methods:
- Fixed box size: You assign a constant point or rupee value, such as 10 points on an index or ₹5 on a stock. The brick size never changes, keeping historical chart proportions uniform across months of data. However, a fixed box struggles when market volatility expands or contracts sharply.
- ATR box size: The charting platform reads the Average True Range (ATR) indicator (commonly a 14-period ATR) from an underlying time-based chart to set the brick threshold dynamically. When volatility rises, brick sizes widen automatically; when volatility quiets down, bricks shrink.
| Feature | Fixed Brick Size | ATR Brick Size |
|---|---|---|
| Calculation basis | Manual static point or rupee value | Dynamic 14-period ATR from underlying time frame |
| Volatility adaptation | Does not adjust to market swings | Expands in volatile sessions and contracts in quiet ones |
| Chart repainting risk | None once historical bricks close | Historical bricks can recalculate if ATR values shift |
| Best suited for | Assets with stable daily point ranges | Equity indices and stocks with shifting intraday volatility |
Tip: Check whether your charting platform locks ATR brick values at the session open or recalculates them continuously, as continuous updates can alter past historical bricks.
How to Read Core Renko Chart Patterns
Because default Renko bricks omit candlestick wicks, price action forms clean geometric blocks that make support, resistance, and trendlines easier to spot. You can apply a trendline trading strategy directly across brick corners without worrying about intraday spike anomalies.
Three structural formations appear frequently on Renko charts:
- Two-brick reversal flip: A single color change often occurs during minor pullbacks, whereas two consecutive bricks in the new direction confirm that momentum has shifted past the initial 2x reversal threshold.
- Double top and double bottom: Price advances to a distinct brick peak, pulls back to form a trough, and tests the exact same brick level before reversing. A breakdown below the trough brick confirms the pattern.
- Head and shoulders: Three sequential peaks form where the central peak rises higher than the two flanking shoulders. Stripping away time and wicks makes the horizontal neckline breakout visually distinct.
Basic Renko Chart Trading Strategy with Trend Filters
Trading every brick color flip in isolation produces frequent whipsaws during sideways markets. Pairing a Renko chart with a 20-period Exponential Moving Average (EMA) calculated on brick closes helps filter counter-trend noise.
Follow these steps to structure a trend-following pullback setup:
- Confirm trend direction: Observe where bricks sit relative to the 20 EMA. Only look for long setups when bricks print consistently above the 20 EMA, and short setups when bricks print below it.
- Wait for a controlled pullback: Allow two to three counter-trend bricks to pull back toward the 20 EMA without closing decisively through the moving average line.
- Enter on a two-brick resumption: Execute the trade when price rejects the 20 EMA and prints two consecutive bricks back in the primary trend direction.
- Define stop-loss and target levels: Place your stop-loss one brick beyond the pullback swing extreme, and measure profit targets using a fixed reward-to-risk ratio.
Reward-to-risk ratio = (Target price − Entry price) ÷ (Entry price − Stop-loss price)
In this hypothetical example using a 10-point brick size, suppose you enter long at 24,050 after two green confirmation bricks bounce off the 20 EMA, with the pullback low at 24,030.
| Trade Parameter | Hypothetical Calculation | Resulting Level |
|---|---|---|
| Entry price | Close of second confirming green brick | 24,050 |
| Stop-loss price | 1 brick (10 points) below the 24,030 pullback low | 24,020 (30-point risk) |
| Target price (2:1 ratio) | 24,050 + (30 points × 2) | 24,110 (60-point reward) |
| Reward-to-risk ratio | (24,110 − 24,050) ÷ (24,050 − 24,020) | 2.0 |
Applying Renko Settings to Indian Indices
Applying Renko analysis to liquid derivatives on the National Stock Exchange (NSE) requires calibrating brick thresholds to each index’s typical intraday range. Because index futures and options involve leverage, losses can exceed your initial margin or premium quickly if brick sizes are mismatched.
- Nifty 50 calibration: Traders commonly test hypothetical fixed sizes between 5 and 10 points, or a 14-period ATR derived from a 5-minute underlying chart. Many intraday participants wait until after 9:45 AM IST to let opening volatility settle before taking signals.
- Bank Nifty calibration: Because Bank Nifty carries a higher nominal value and wider point swings than Nifty 50, traders typically use larger thresholds—such as 20 to 30 points in fixed setups—to avoid excessive brick flips and higher brokerage or statutory charges.
Warning: Renko charts mask overnight gaps at the 9:15 AM IST market open by printing multiple bricks simultaneously, which can trigger severe slippage on pending market orders.
Advantages and Limitations of Renko Charts
Every technical charting style involves a trade-off between visual clarity and execution timing. Evaluating both sides helps you decide where Renko fits into your intraday workflow.
| Advantages | Limitations |
|---|---|
| Filters minor market noise: Compresses narrow sideways price swings into blank space so trends remain legible. | Inherent entry and exit lag: A brick only prints after price completes the full threshold, delaying signals compared to candlesticks. |
| Clarifies support and resistance: Eliminates jagged wicks, making horizontal breakout levels and trendlines easier to identify. | Obscures time and volume velocity: Removing the time axis hides whether a move took two minutes or two hours to develop. |
| Reduces emotional overtrading: Fewer visual updates during choppy afternoon sessions help prevent impulsive entries. | Vulnerable to gap distortions: Large opening gaps generate instant multi-brick jumps that distort moving averages and stop placements. |
Monetyra’s Take
Renko charts offer a structured way to strip away intraday candlestick noise and keep your focus on directional price movement. However, that visual simplicity comes at the cost of delayed entries and hidden time dynamics, especially around volatile market opens on Indian exchanges. Traders who use Renko effectively treat it as a trend-filtering lens paired with strict position sizing rather than a standalone signal generator.
Conclusion
A Renko chart simplifies technical analysis by replacing time-based candles with uniform bricks driven purely by price distance. Whether you configure a static fixed box or a dynamic 14-period ATR setting, pairing brick structure with a trend filter like the 20 EMA helps you separate sustained momentum from sideways noise. Always account for brick lag and opening gap risks before placing live intraday orders.
Continue Learning Day Trading Mechanics
Explore structured setups, risk rules, and chart tools for Indian sessions.
FAQs
1. What is a Renko chart and how does it work?
A Renko chart is a price-based technical charting tool that builds uniform bricks whenever price moves a specified distance, ignoring time completely. Green bricks form when price rises by one full brick threshold, while red bricks appear when price falls by double the brick size in the opposite direction.
2. Is a Renko chart good for intraday trading?
Renko charts can help intraday traders filter minor price noise and stay aligned with primary trends during steady sessions. However, because bricks ignore time and overnight gaps, traders on the NSE often avoid taking signals right at the 9:15 AM IST market open to reduce slippage risk.
3. How do you choose the best brick size for Renko charts?
The ideal brick size depends on an asset’s volatility and your holding horizon. Many intraday traders use a 14-period ATR from an underlying 5-minute chart so brick thresholds adjust automatically, while others test fixed point values suited to the index’s typical daily swing.
4. What are the best Renko chart patterns?
Commonly tracked Renko formations include two-brick reversal flips, double tops and double bottoms, and head and shoulders patterns. Because Renko removes candlestick wicks, horizontal support, resistance, and neckline breakout levels appear cleaner than on standard time-based charts.
5. Which indicator works best with Renko charts?
A 20-period Exponential Moving Average (EMA) applied to brick closes is widely paired with Renko charts. The EMA acts as an objective trend filter, helping traders focus on pullback entries in the dominant trend direction while avoiding false flips in range-bound markets.
Disclaimer: This article was written with the help of AI and edited by the Monetyra editorial team. It is for educational purposes only and should not be considered financial advice. Trading and investing in financial instruments involve significant risk of loss and are not suitable for all investors, and past performance of any strategy does not guarantee future results. Please consult a licensed financial advisor before making any investment or trading decision.