Market Microstructure: How Orders Shape Price Discovery

When you place an equity trade on a brokerage platform, execution appears instantaneous, yet behind every filled order operates a network of matching engines, liquidity queues, and routing protocols. Most market participants evaluate companies through fundamental valuation or chart patterns, overlooking how exchange architecture shapes short-term price movements and transaction costs. Understanding market microstructure clarifies why orders fill at specific prices, how liquidity absorbs volume, and where execution friction arises during volatile sessions.
Quick Takeaways
- Market microstructure examines the exchange rules, order-matching mechanics, and liquidity structures that turn buy and sell orders into executed market prices.
- Automated limit order books, bid-ask spreads, market makers, and order types interact continuously to establish real-time price discovery on venues such as the NSE.
- Large institutional orders can consume multiple price levels and trigger slippage, though wide spreads and sudden liquidity withdrawals during volatile sessions still expose traders to execution risk.
What Is Market Microstructure?
Market microstructure is the branch of financial economics studying how exchange rules, order-matching protocols, and liquidity mechanisms translate trading interest into executed prices.
Classical economic models often assume frictionless markets where prices adjust instantaneously to new information. In practice, trading venues operate with structural frictions, including bid-ask spreads, order-processing latency, asymmetric information, and minimum tick sizes.
Modern Indian equity markets process trades through automated electronic limit order book (ELOB) systems. The National Stock Exchange (NSE) operates its NEAT (National Exchange for Automated Trading) engine, while the Bombay Stock Exchange (BSE) runs BOLT (BSE On-Line Trading). These engines collect incoming orders from institutional desks and retail brokers, rank them by strict priority rules, and execute matches without manual intervention.
Core Components Driving Price Discovery
Price discovery relies on four structural components working together inside an electronic matching engine to clear supply and demand.
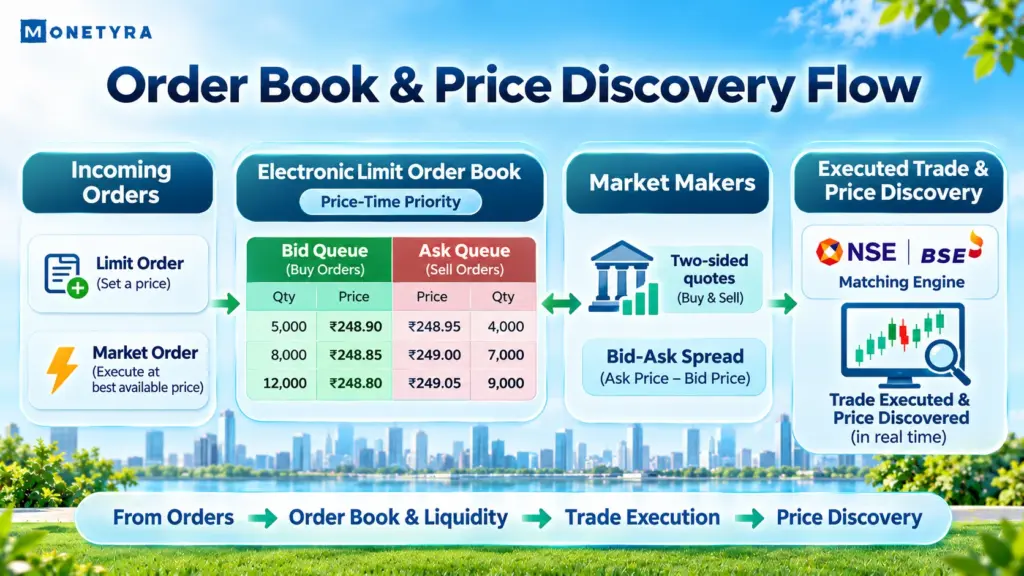
- Electronic Limit Order Book (ELOB): The central digital ledger displays resting buy orders (bids) from highest to lowest price and sell orders (asks) from lowest to highest price. Matching engines follow price-time priority (First In, First Out or FIFO), executing the highest bid and lowest ask first before clearing older orders at the same price level. For a detailed walkthrough of queue tiers, see how to read market depth in an order book.
- Bid-Ask Spread: The gap between the lowest resting ask and the highest resting bid represents the immediate transaction cost of crossing the book. Tight spreads indicate deep liquidity, whereas wide spreads reflect higher execution friction. Learn more about how bid and ask prices determine spreads.
- Market Makers and Liquidity Providers: Specialized trading firms and designated market makers continuously quote two-sided bid and ask prices. They earn the spread as compensation for absorbing temporary order imbalances and holding inventory risk when asymmetric news arrives.
- Order Types: Limit orders rest on the book and supply liquidity at a specified price or better, whereas market orders demand immediate execution by consuming existing resting liquidity across available price levels.
Liquidity, Slippage, and Large-Order Market Impact
Liquidity measures a market’s capacity to absorb large order volumes without triggering sharp price dislocations. Rather than reflecting daily traded volume alone, true liquidity depends on resting depth across multiple price levels and market resilience, which is how rapidly liquidity providers replenish quotes after a sweep.
When an institutional participant submits a large market order that exceeds the volume resting at the best bid or ask, the matching engine sweeps deeper into the order book. This creates two distinct effects:
- Temporary Market Impact: Immediate price movement caused by exhausting resting liquidity at top price tiers, which often partially reverts once new limit orders refill the book.
- Permanent Market Impact: Lasting price adjustment driven by the market inferring that the large order reflects new fundamental information.
To measure execution drag on aggressive orders, traders calculate slippage using the following formula:
Slippage = Executed Average Price − Expected Top-of-Book Price
Consider a hypothetical example on the NSE where an investor submits a market buy order for 1,000 shares of a mid-cap stock while the top ask displays only 400 shares at ₹500.00.
| Price Level | Available Ask Quantity | Shares Filled | Total Cost (₹) |
|---|---|---|---|
| Level 1 (Best Ask) | 400 shares at ₹500.00 | 400 | ₹2,00,000 |
| Level 2 | 400 shares at ₹501.00 | 400 | ₹2,00,400 |
| Level 3 | 300 shares at ₹502.50 | 200 | ₹1,00,500 |
| Total / Average | 1,100 shares available | 1,000 shares | ₹5,00,900 (Avg: ₹500.90) |
In this hypothetical example, the volume-weighted average fill price is ₹500.90 instead of ₹500.00, resulting in ₹0.90 per share (₹900 total) in slippage. Institutional desks often mitigate this visibility and impact by slicing large blocks through algorithms or using how an iceberg order conceals total order volume.
Warning: Submitting unconditioned market orders in thinly traded small-cap stocks or illiquid options contracts can trigger severe slippage when order book depth gaps between price tiers.
Valuation vs. Price Discovery in Equity Markets
Fundamental valuation and price discovery perform separate roles in capital markets, even though traders frequently conflate the two concepts. Valuation estimates intrinsic worth over multi-quarter horizons using discounted cash flows, earnings growth, and balance sheet metrics. Price discovery is the continuous, real-time auction process that reconciles competing buy and sell order flows into an observable clearing price.
| Dimension | Fundamental Valuation | Price Discovery Process |
|---|---|---|
| Primary Driver | Corporate earnings, cash flows, macro rates | Order flow, book depth, liquidity imbalances |
| Time Horizon | Long-term (quarters to years) | Real-time (milliseconds to intraday sessions) |
| Core Mechanism | Financial modeling and peer multiples | Electronic order matching (Price-Time Priority) |
| Market Output | Estimated intrinsic value range | Executed transaction price |
Even when a company’s intrinsic valuation remains unchanged, sudden institutional rebalancing or news-driven order imbalances can shift real-time price discovery. Examining auction market theory and price balance helps clarify how markets alternate between balanced value zones and directional price discovery phases.
Indian Market Microstructure: NSE Mechanics and SEBI Algo Rules
Indian equity exchanges operate under strict structural safeguards overseen by the Securities and Exchange Board of India (SEBI) to maintain orderly price discovery and protect market integrity.
- Pre-Open and Closing Call Auctions: From 09:00 AM to 09:15 AM IST, the NSE conducts a pre-open call auction to aggregate overnight order flow and determine an equilibrium opening price before continuous trading begins. Effective August 3, 2026, the NSE also introduced a Closing Auction Session (CAS) for the equity cash segment to determine closing prices through consolidated auction matching rather than relying solely on the final 30-minute volume-weighted average.
- Algorithmic and High-Frequency Trading (HFT) Controls: Under SEBI’s retail algorithmic trading framework, fully effective from April 1, 2026, all retail algorithmic orders require exchange-registered unique Algo IDs, mandatory static IP mapping, and server hosting located within India. Exchanges also enforce order-to-trade ratio (OTR) thresholds and co-location compliance standards to prevent excessive order-book spoofing or quote stuffing.
- Price Bands and T+1 Settlement: Individual securities operate within daily price bands (such as 2%, 5%, 10%, or 20% depending on index and derivatives eligibility) to contain extreme order imbalances, while post-trade clearing runs on a T+1 settlement cycle that reduces counterparty exposure.
Practical Implications for Retail Traders
Retail participants do not require co-located servers to benefit from microstructure awareness, as basic order-routing discipline directly affects net execution costs.
- Prefer Limit Orders in Thin Books: Placing limit orders near the prevailing bid or ask prevents accidental sweeps across wide spreads, though limit orders carry the risk of non-execution if prices move away rapidly.
- Assess Level 2 Depth Before Sizing Up: Checking multi-tier bid and ask quantities helps confirm whether visible liquidity can absorb your intended position size without excessive market impact.
- Account for Intraday Liquidity Cycles: Bid-ask spreads typically widen around the 09:15 AM IST market open and ahead of major macroeconomic releases, increasing implicit transaction costs even when explicit brokerage fees remain flat.
Tip: When trading stocks with wider spreads, placing a limit order near the bid-ask midpoint often reduces implicit spread costs compared with crossing the book via a market order.
Monetyra’s Take
Most retail traders spend hours refining chart indicators while losing measurable basis points to avoidable spread crossing and poorly timed market orders. Understanding order book mechanics will not predict where a stock moves next, yet pairing limit-order discipline with SEBI’s transparent auction sessions gives individual investors cleaner execution in volatile Indian markets.
Conclusion
Market microstructure governs how exchange matching engines, liquidity providers, and order types convert trading intent into real-time prices. Recognizing the distinction between intrinsic valuation and order-driven price discovery helps you evaluate market depth, anticipate large-order slippage, and navigate Indian market rules with greater precision. Keep in mind that liquidity conditions shift rapidly during market openings and news events, making disciplined order selection an ongoing necessity.
Explore More Market Analysis
Dive deeper into institutional order flows, regulatory updates, and equity market mechanics across our latest research guides.
FAQs
1. What is market microstructure in stock trading?
Market microstructure is the study of how exchange rules, electronic order books, and liquidity mechanics match buy and sell orders to establish real-time market prices. It focuses on real-world trading frictions such as bid-ask spreads, execution priority rules, and market impact costs.
2. What are the main components of market microstructure?
The core components include the electronic limit order book (ELOB), bid-ask spreads, market makers providing two-sided liquidity, order execution priority rules (price-time priority), and order types. Together, these elements determine execution speed, fill prices, and overall market depth.
3. How does price discovery differ from fundamental valuation?
Fundamental valuation estimates an asset’s intrinsic value over long horizons using corporate earnings, cash flows, and macroeconomic conditions. Price discovery is the continuous, real-time auction process where competing buy and sell orders match on an exchange to set the current clearing price.
4. How do large institutional orders cause market impact?
When a large order exceeds the share quantity available at the best bid or ask price, the matching engine sweeps through deeper price tiers in the order book. This pushes the volume-weighted average fill price away from the initial quote, creating slippage and temporary or permanent price shifts.
5. How does SEBI regulate algorithmic trading in Indian market microstructure?
Under SEBI’s retail algorithmic trading framework, fully effective from April 1, 2026, algorithmic orders must carry exchange-registered unique Algo IDs, route through static IPs, and run on servers hosted within India. Exchanges also enforce order-to-trade ratio limits to preserve order book stability.
Disclaimer: This article was written with the help of AI and edited by the Monetyra editorial team. It is for educational purposes only and should not be considered financial advice. Trading and investing in financial instruments involve significant risk of loss and are not suitable for all investors. Please consult a licensed financial advisor before making any investment or trading decision.