Rolling Returns Mutual Fund: Meaning, Calculation & Guide
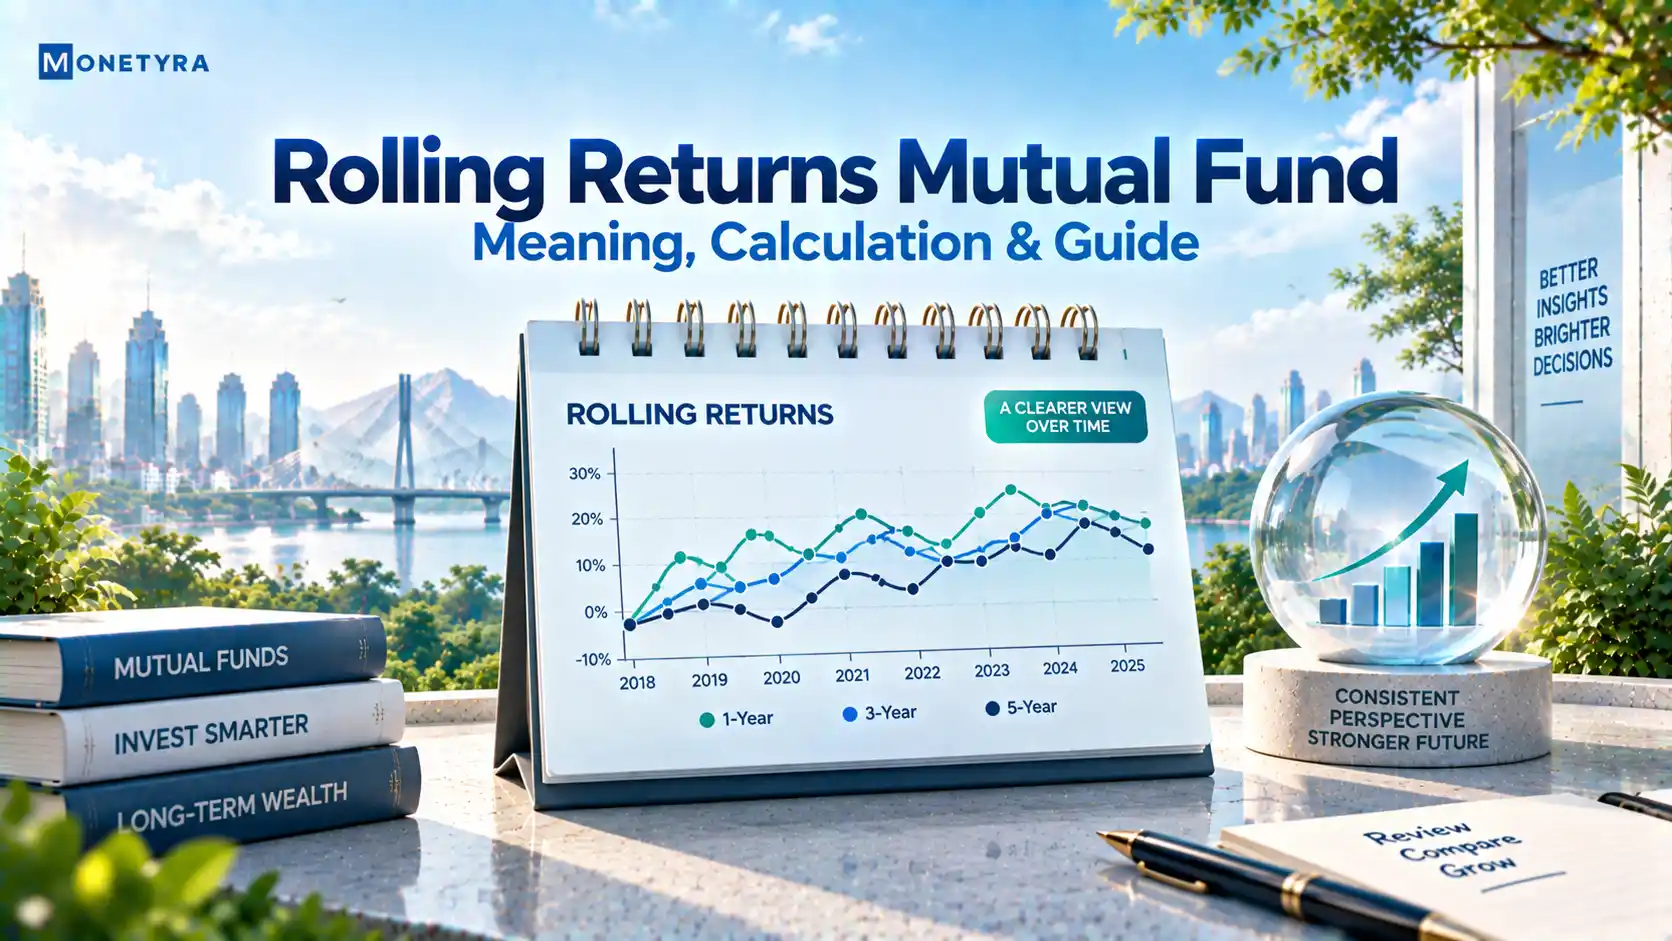
Evaluating a scheme’s true consistency requires looking past traditional point-to-point returns, which is where rolling returns mutual fund analysis becomes essential. Unlike standard annualized returns that are highly sensitive to specific start and end dates, rolling returns measure a fund’s annualized performance across overlapping, continuous time blocks over a selected duration.
Understanding how rolling returns work, how to calculate them, and why they offer a clearer picture of fund stability helps retail investors select resilient mutual funds across all market cycles.
Quick Takeaways
- A rolling returns mutual fund metric evaluates performance across multiple overlapping holding windows to eliminate start-and-end-date timing bias.
- Unlike trailing point-to-point Compound Annual Growth Rate (CAGR), rolling returns reveal how consistently a scheme delivers gains across bull, bear, and sideways market cycles.
- While historical rolling return distributions provide deeper analytical clarity, past return consistency does not offer guaranteed protection against future market volatility.
What Are Rolling Returns in Mutual Funds?
Rolling returns are annualized returns calculated continuously across overlapping time blocks (such as 3-year or 5-year periods) by shifting the starting date forward daily or monthly.
In traditional performance reporting governed by the Securities and Exchange Board of India (SEBI), mutual fund schemes display trailing point-to-point returns (1-year, 3-year, or 5-year CAGR). However, trailing returns measure performance between two fixed calendar dates. If an investor checks a fund’s 3-year CAGR during a bull market peak, the return figure looks exceptionally high—even if the fund underperformed for most of the preceding period.
By shifting the calculation window forward day by day over a 5-year or 10-year horizon, rolling returns evaluate hundreds of independent holding periods. This eliminates point-to-point bias, showing how a fund performs regardless of when an investor deploys capital—whether through a single deployment or an automated What Is SIP in Mutual Fund . Understanding this concept helps investors interpret metrics beyond basic CAGR Meaning in Mutual Fund.
Tips: Use 3-year or 5-year rolling windows when evaluating equity mutual funds to smooth out short-term market noise and observe true long-term consistency.
Rolling Returns vs Point to Point Returns
Comparing rolling returns vs point to point returns highlights why trailing CAGR figures can mislead retail investors:
| Feature | Point-to-Point Returns (Trailing CAGR) | Rolling Returns |
|---|---|---|
| Calculation Method | Single start date to single end date | Hundreds of overlapping blocks shifted daily/monthly |
| Timing Sensitivity | Highly sensitive to market highs/lows on chosen dates | Neutralizes market timing by averaging all blocks |
| Consistency View | Shows total growth over one fixed timeline | Shows return probability distribution across cycles |
| Primary Risk Hidden | Masks long periods of scheme underperformance | Exposes minimum, maximum, and negative return windows |
| Best Used For | Quick historical snapshots | Comprehensive fund manager evaluation |
The Point-to-Point Timing Trap
Suppose Scheme A and Scheme B both report a 3-year trailing CAGR of 15% today:
- Scheme A: Experienced extreme volatility, remaining negative for two years before a sharp speculative rally pushed its final NAV up right at the 3-year mark.
- Scheme B: Delivered steady 14%–16% annualized growth across almost every 3-year rolling block over the same multi-year period.
While trailing point-to-point CAGR treats both funds as identical, a rolling returns mutual fund analysis reveals Scheme B as the superior, less volatile option.

How to Calculate Rolling Returns in Mutual Funds
To calculate rolling returns mutual fund metrics, analytics tools shift a specified holding window across a historical dataset.
The Rolling Return Formula
For a 3-year holding window (1,095 days), each rolling data point is calculated using standard annualization:
Rolling Return (%) = [ ( Ending NAV ÷ Starting NAV ) ^ ( 365 ÷ Holding Days ) – 1 ] × 100
Calculation Steps
- Define the Window: Select a holding duration (e.g., 3 years) and an overall historical analysis period (e.g., 10 years).
- Calculate First Block: Compute the annualized return from Day 1 to Day 1,095.
- Roll the Start Date: Shift the start date forward to Day 2 and compute the annualized return from Day 2 to Day 1,096.
- Repeat Across Dataset: Continue rolling the window forward daily until reaching the latest available Net Asset Value (NAV).
This process generates thousands of return data points. Platforms like Value Research, AdvisorKhoj, or an advanced Mutual Fund Returns Calculator aggregate these points into key statistical outputs:
- Average Rolling Return: The mean annualized return across all evaluated blocks.
- Minimum & Maximum Return: The worst and best returns an investor would have experienced.
- Consistency Score (% Outperformance): The percentage of rolling windows where the fund beat its benchmark index (e.g., Nifty 50 TRI).
How to Find the Best Rolling Returns Mutual Fund in India
Finding the best rolling returns mutual fund india candidates requires evaluating consistency across full market cycles rather than selecting top-ranking schemes from recent 1-year performance charts.
1. Check Return Consistency
Look for schemes that beat their category benchmark index in at least 70% to 80% of all 3-year or 5-year rolling windows over a 7-to-10-year period.
2. Examine Minimum Rolling Returns
Check the worst-case scenario. A fund that maintained a positive minimum rolling return during severe market crashes demonstrates strong downside protection.
3. Evaluate Cash-Flow Alignment
Whether allocating capital via SIP vs Lumpsum deployments, high rolling consistency ensures that individual cash debits compound reliably over time, improving your overall internal rate of return tracked by XIRR Meaning in Mutual Fund.
Warning: High maximum rolling returns during bull markets often signal excessive risk-taking; prioritize average consistency and downside protection over temporary peak returns.
Key Limitations of Rolling Returns
While rolling returns offer superior analytical depth, investors should recognize operational boundaries endorsed by the Association of Mutual Funds in India (AMFI):
- Historical Perspective: Rolling returns reflect historical data and cannot predict future fund manager decisions or changing macroeconomic trends.
- Computational Complexity: Daily rolling calculations require specialized financial portals rather than quick mental math.
- Window Length Dependency: Selecting excessively short rolling windows (e.g., 1-month or 3-month) reintroduces market noise and reduces long-term analytical value.
Conclusion
Analyzing a rolling returns mutual fund dataset provides retail investors with an accurate view of performance consistency and risk management. By replacing point-to-point trailing CAGR with overlapping historical windows, rolling returns remove timing luck from fund evaluation. When selecting equity mutual funds in India, focusing on high average rolling returns, strong benchmark outperformance consistency, and resilient minimum return floors helps build a long-term portfolio aligned with your financial goals.
Master mutual fund metrics, calculation formulas, and regulatory standards with our clear educational guides.
FAQs
Rolling returns are annualized returns calculated across overlapping holding periods (e.g., 3-year blocks) shifted daily. For example, calculating returns from Jan 1 to Jan 1 three years later, then Jan 2 to Jan 2, across a 10-year period provides hundreds of continuous 3-year return figures.
Rolling returns matter because they eliminate start-and-end date timing bias, showing how consistently a fund delivers performance across bull, bear, and sideways market phases.
Rolling returns are calculated by shifting a fixed holding window (e.g., 3 years) forward daily across a historical NAV dataset, calculating annualized compound growth for each individual block.
Look for equity funds that beat their benchmark index in over 70% to 80% of 3-year or 5-year rolling windows over a 7-to-10-year period, while maintaining positive minimum rolling returns during market downturns.
Yes, rolling return analysis is generally better than single-period CAGR because it neutralizes market timing luck and reveals a fund’s actual performance distribution over full market cycles.
Disclaimer: This article was written with the help of AI and reviewed by the Monetyra editorial team. It is for educational purposes only and should not be considered financial advice. Trading and investing in financial instruments involve significant risk of loss and are not suitable for all investors. Please consult a licensed financial advisor before making any investment decision.
In India, mutual fund operations are regulated by the Securities and Exchange Board of India (SEBI) and trade execution platforms are hosted across exchanges like the National Stock Exchange (NSE). Investors should evaluate scheme documents carefully before committing capital.