Drawdown Meaning: How Peak-to-Trough Losses Work in Markets

Understanding drawdown meaning helps you measure how much money a trading account or mutual fund loses from a high point before recovering. While return figures highlight profits, drawdown shows the downside your capital actually goes through along the way.
Many retail participants focus almost exclusively on annualized gains, yet fund managers and experienced traders evaluate strategies through downside containment first. A loss of 50% requires a 100% gain just to get back to breakeven. This guide explains the drawdown meaning, how to calculate maximum drawdown in rupees, why recovery math works against deep losses, and how to evaluate drawdown across both active trading accounts and mutual funds.
Quick Takeaways
- Peak-to-Trough Loss Measure: Drawdown tracks the percentage drop from an account or fund’s highest peak to its lowest point before a new peak is reached.
- Asymmetric Recovery Math: Because losses shrink your remaining capital base, deeper drawdowns require exponentially larger gains to break even—a 50% drop demands a 100% return.
- Historical Limits Do Not Cap Future Losses: Backtested drawdown numbers reflect past market conditions only; live slippage, overnight gaps, and sudden shifts in market conditions can produce deeper declines.
What Is Drawdown Meaning in Trading and Investing?
In trading and investing, drawdown meaning is the peak-to-trough percentage decline in an account, fund, or asset value before a new high is reached. It measures real capital erosion during a losing stretch rather than day-to-day price noise.
Every drawdown cycle moves through three distinct stages on an equity curve or Net Asset Value (NAV) chart:
- The Peak: The highest valuation your trading capital or mutual fund portfolio reaches during a given period.
- The Trough: The lowest valuation point hit after that peak, before prices climb back to set a fresh high.
- The Recovery (Underwater Period): The time and percentage gain needed to climb from the trough back to the prior peak.
Traders track two variations of this metric. Current drawdown shows how far below its all-time high your live account sits right now. Maximum drawdown (MDD) records the single worst peak-to-trough drop across an entire historical track record. Tracking both metrics keeps you aware of immediate pressure while benchmarking your strategy against its worst past performance.
How to Calculate Drawdown and Maximum Drawdown
To find maximum drawdown, identify the highest peak value that occurs before the lowest subsequent trough over a chosen timeframe. You should always measure the decline from the highest prior peak, not from your initial starting deposit.
Maximum Drawdown (%) = ((Peak Value − Trough Value) ÷ Peak Value) × 100
Consider a hypothetical swing trading portfolio on the National Stock Exchange (NSE) tracked over 12 months:
- Starting Capital: ₹10,00,000
- Month 3 Peak: Account grows to ₹12,00,000
- Month 6 Trough: After a series of losing trades, equity drops to ₹8,00,000
- Month 9 Recovery: Account climbs back to ₹12,00,000
- Month 12 New Peak: Equity reaches ₹13,50,000
Using the formula on this hypothetical example:
- Rupee Drawdown: ₹12,00,000 − ₹8,00,000 = ₹4,00,000
- Maximum Drawdown (%): (₹4,00,000 ÷ ₹12,00,000) × 100 = 33.33%
Even though the account ended the year with a net profit of ₹3,50,000, the trader endured a 33.33% peak-to-trough decline mid-year. Measuring from the ₹10,00,000 starting capital instead of the ₹12,00,000 peak would understate the actual drawdown pain.
Why Drawdown Recovery Is Non-Linear
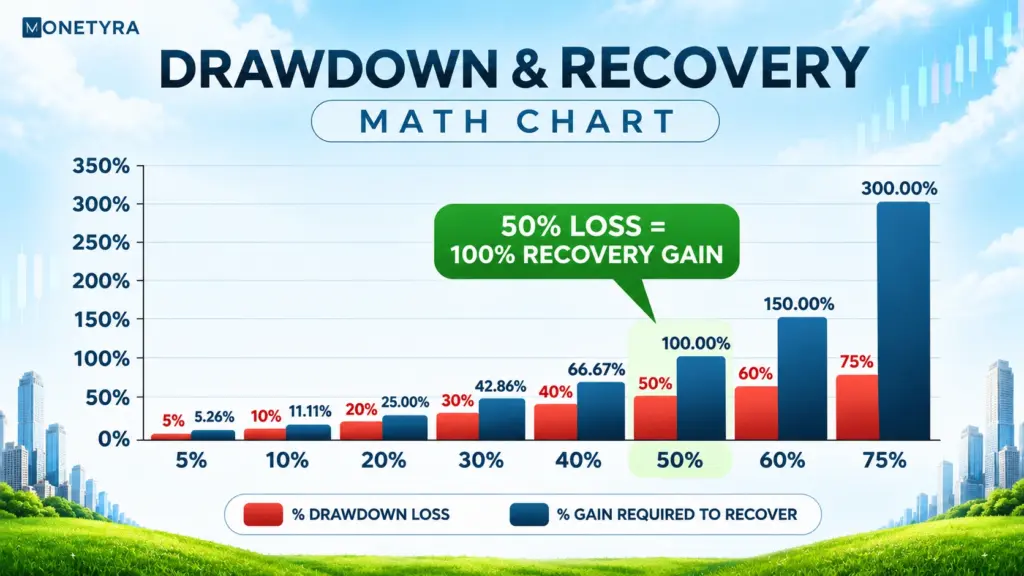
Drawdown recovery is mathematically asymmetric because every loss reduces the capital base available to generate future returns. A 10% loss does not require a 10% gain to recover; it requires an 11.11% gain on the smaller balance.
Required Recovery (%) = ((1 ÷ (1 − Drawdown Decimal)) − 1) × 100
| Drawdown Depth (%) | Remaining Capital (from ₹10,00,000) | Gain Required to Break Even (%) | Impact on Account Survival |
|---|---|---|---|
| 5% | ₹9,50,000 | 5.26% | Routine market fluctuation |
| 10% | ₹9,00,000 | 11.11% | Manageable pullback |
| 20% | ₹8,00,000 | 25.00% | Standard correction phase |
| 30% | ₹7,00,000 | 42.86% | Heavy drawdown requiring strict discipline |
| 40% | ₹6,00,000 | 66.67% | Severe capital impairment |
| 50% | ₹5,00,000 | 100.00% | Must double remaining capital to recover |
| 60% | ₹4,00,000 | 150.00% | Extended recovery timeline likely |
| 75% | ₹2,50,000 | 300.00% | Near-total capital depletion |
Once a drawdown crosses 30% to 40%, the math turns steep against you. If you are unsure how your win rate and risk per trade interact during losing streaks, testing your numbers in a risk of ruin calculator shows how quickly consecutive losses can push an account past recovery.
How Drawdown Applies to Mutual Funds and Portfolios
Drawdown is not just an intraday trading metric; mutual fund investors and long-term portfolio managers use it to judge how well a scheme protects capital during bear markets. When an equity mutual fund’s NAV drops from ₹100 to ₹80 during a broad market sell-off, that 20% decline is its drawdown.
Comparing two funds with identical 12% annualized returns becomes clearer when you check their maximum drawdowns. A fund that fell 18% during a market downturn preserved capital far better than a rival fund that dropped 35% to deliver the same average return.
- Drawdown vs. Volatility: Standard deviation measures price swings in both directions around an average, penalizing sharp upward rallies just like downward drops. Drawdown isolates downside loss only, capturing the worst continuous decline an investor actually sits through.
- Calmar Ratio: This metric divides annualized return by maximum drawdown. A higher Calmar ratio signals stronger returns per unit of peak-to-trough loss.
- Sortino Ratio: Unlike standard volatility tools, the Sortino ratio evaluates return relative to downside deviation only. Investors often pair drawdown analysis with the Sharpe ratio (return earned per unit of total volatility) to compare volatility-adjusted performance against worst-case downside drops.
Acceptable drawdown ranges depend on your strategy and holding horizon:
- Conservative Debt or Hybrid Mutual Funds: Some investors treat drawdowns of roughly 5% to 10% as a comfortable range, though actual results vary by scheme and market conditions.
- Diversified Equity Mutual Funds and Swing Portfolios: Can sometimes see drawdowns of roughly 15% to 25% during broader market corrections, though deeper declines are possible.
- Active Intraday and F&O Strategies: Some traders set account drawdown caps around 15% to 20% to help reduce margin stress.
Tip: When evaluating a backtested trading system, some traders multiply its historical maximum drawdown by 1.5x to 2x as a rough live risk buffer, though real drawdowns can still exceed this estimate.
Practical Ways to Control Drawdown and Common Mistakes
Controlling drawdown requires pre-set mechanical limits rather than relying on willpower mid-session. Defining your maximum acceptable loss before placing a trade can help keep routine losing streaks from turning into account-threatening events.

Controls That Limit Drawdown Depth
- Fixed Fractional Risk Per Trade: Cap your potential loss on any single setup at 1% to 2% of total account equity inside a structured trading risk management plan. Even ten consecutive losses at 1% risk leave roughly 90% of your capital intact.
- Daily and Weekly Circuit Breakers: Set an automated stop for the day if your equity drops by 2% to 3% in a single session. Stepping away halts emotional decision-making when market conditions do not match your setup.
- Dynamic Position Scaling: Cut your position size in half once your account reaches a 10% drawdown from its peak, restoring full size only after you recover half of that dip.
Common Mistakes That Deepen Drawdowns
- Revenge Trading After a Red Session: Doubling lot sizes or adding leverage to win back losses quickly usually compounds the drawdown when the next trade also fails. Following strict trading discipline rules for capital protection can help reduce impulsive overtrading during losing streaks.
- Widening or Removing Stop-Loss Orders: Moving a stop-loss further away in hopes of a bounce turns a planned 1% loss into an uncontained structural drawdown.
- Averaging Down on Losing Intraday Positions: Adding more capital to a losing leveraged trade increases exposure right when market momentum is moving against you.
Drawdown Considerations in Indian Markets (NSE and BSE)
Active participants on the NSE and the Bombay Stock Exchange (BSE) face structural market features that can accelerate drawdowns if left unhedged.
- Overnight Gap Risk at 09:15 AM IST: Global macro news, US market swings, or earnings announcements released after the 03:30 PM IST close can trigger sharp opening gaps. Stop-loss orders on positional trades do not fill until the market opens, meaning actual slippage can push a loss beyond your planned drawdown limit.
- Index F&O Leverage Sensitivity: Trading Nifty 50 or Bank Nifty futures and options magnifies small index moves into large percentage swings on margin capital. Without strict lot sizing, a single volatile expiry session can erase weeks of steady gains.
- SEBI Margin Frameworks: Following upfront margin norms set by the Securities and Exchange Board of India (SEBI) restricts excessive intraday leverage, helping protect retail accounts from sudden forced square-offs during sharp market drops.
Monetyra’s Take
Understanding drawdown meaning gives you a useful reality check for any trading strategy or mutual fund because it shows how deep a loss you may have to sit through before earning a return. While tracking maximum drawdown keeps you honest about tail risk and prevents over-leveraging, backward-looking drawdown numbers can never guarantee how a portfolio will behave during an unfamiliar market shock. Treat historical drawdown as a baseline floor for risk planning, and pair it with strict per-trade loss caps to help reduce the chance that a single bad week forces you out of the market.
Conclusion
Understanding drawdown meaning shifts your focus from chasing headline returns to protecting the capital that keeps you in the market. Measuring peak-to-trough declines, respecting the non-linear math of recovery, and setting firm daily loss limits apply equally whether you manage an active trading account or evaluate mutual funds. Pair these risk boundaries with consistent position sizing so routine losing streaks remain manageable setbacks rather than permanent damage.
Continue Building Your Intraday Risk Framework
Explore structured trade execution, position sizing, and session planning guides to keep account drawdowns under control.
FAQs
1. What is drawdown meaning in trading and investing?
The drawdown meaning is the percentage decline in a trading account, mutual fund NAV, or investment portfolio from a historical peak to its lowest trough before a new peak is formed. It measures the actual downside loss experienced during a losing period rather than temporary intraday price fluctuations.
2. How do you calculate maximum drawdown?
To calculate maximum drawdown, subtract the lowest trough value from the highest prior peak value, divide that difference by the peak value, and multiply by 100. For example, if a hypothetical portfolio drops from a peak of ₹12,00,000 to a trough of ₹8,00,000, the maximum drawdown is 33.33%.
3. What is a good drawdown percentage?
Some investors treat drawdowns of roughly 5% to 10% as a comfortable range for conservative debt or hybrid mutual funds, and roughly 15% to 25% for diversified equity funds or active traders, though actual results vary.
4. What is the difference between drawdown and volatility?
Volatility measures how widely returns fluctuate in both upward and downward directions around an average, usually via standard deviation. Drawdown measures downside risk exclusively, tracking the worst continuous peak-to-trough capital loss an investor endures before prices recover to a new high.
5. Why does a 50% drawdown require a 100% gain to recover?
A 50% drawdown cuts your capital base in half, leaving only 50% of your original money to generate future returns. Earning back the lost half from that smaller remaining balance requires doubling your current capital, which equals a 100% gain.
Disclaimer: This article was written with the help of AI and edited by the Monetyra editorial team. It is for educational purposes only and should not be considered financial advice. Trading and investing in financial instruments involve significant risk of loss and are not suitable for all investors, and past performance of any strategy does not guarantee future results. Please consult a licensed financial advisor before making any investment or trading decision.